Download
1 / 18
180 likes | 327 Vues
Fire, nitrogen loss, and nitrogen availability in black spruce forests of Interior Alaska Michelle C. Mack 1 , Leslie A. Boby 1 , Edward A.G. Schuur 1 , Jill F. Johnstone 2 , Teresa N. Hollingsworth 3 and F.S. Chapin, III 3 1 University of Florida 2 University of Saskatchewan

E N D
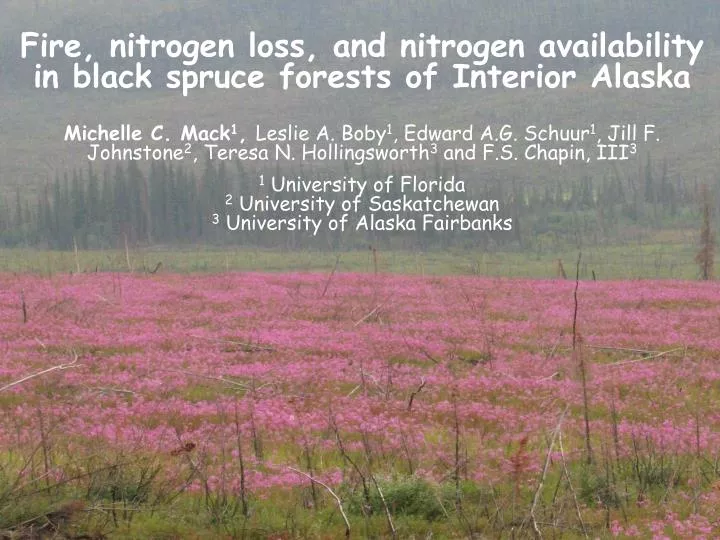
Fire, nitrogen loss, and nitrogen availability in black spruce forests of Interior Alaska Michelle C. Mack1, Leslie A. Boby1, Edward A.G. Schuur1, Jill F. Johnstone2, Teresa N. Hollingsworth3 and F.S. Chapin, III3 1 University of Florida 2 University of Saskatchewan 3 University of Alaska Fairbanks
↑[CO2] ↑ T ? NECB - Energy balance ↓ productivity ↑ Fire ↓ N pools ↑ fire severity and area burned
↓ productivity ↓ N pools ↑[CO2] ↑ T + NECB ↑ Fire ↑ fire severity and area burned
Study system: black spruce (Picea mariana) forests of Interior Alaska • 70% of forest area • Natural fire regime • Severe, stand replacing • Return interval: 70-150 yrs • Majority of ecosystem N stored in forest floor • Plant productivity is N-limited throughout succession • 2004: 6.4 million acres burned • Question: • How does fire severity affect N loss and how does this interact with ecosystem structure?
Study design: • 82 extensive sites in 3 large fire complexes that burned in 2004 • 32 intensive sites chosen to max. variation in drainage and burn severity • Measurements in 2005: • Burn severity • C and N pool loss and structure • Vegetation recovery and tree recruitment • N cycling and plant productivity
Severity: High Low Dry Moisture: Wet
How does increasing burn severity affect soil N loss ? Observation: Severity and N loss will be positively related. H1: Wet sites will have similar absolute N loss to dry sites BUT lower relative N loss than dry sites. H2: Absolute amount of N loss will be positively related to pre-fire N pool size. H3: Relative N loss will be negatively related to pre-fire N pool.
Calculating soil N loss Net loss of N from forest floor/organic soil = Pre-fire forest floor N pool - Remaining N pool [+ Ash from plants and upper layers] [- Leaching, erosion, gaseous loss]
Adventitious root Mean offset between adv. roots and moss across 30 unburned sites: 3.2 ± 0.3 cm
N pool in missing layers = root collar depth x empirical relationships derived from unburned stands Residual organic soil depth, bulk density and [N] Adventitious root collar to burned soil = depth of organic matter combusted
Burn severity Low High Soil organic layer N loss across sites 0.12 • No effect of moisture on absolute N loss supports H1. 0.11 * 0.10 0.09 0.08 N loss (kg N m-2) 0.07 0.06 0.05 0.04 0.03 Dry Wet Moisture class Moisture: F=0.69, P=0.41 Severity: F=4.62. P=0.04 M x S: F=0.19, P=0.67
Burn severity Low High Soil organic layer N loss across sites 0.12 • Mean =80 ± 4 g·N m-2 0.11 * 0.10 • 15-100 % of organic layer N pool 0.09 0.08 N loss (kg N m-2) 0.07 • N inputs are low • Alder fixation max. • Lichen/moss norm. (~0.1g·N m-2 yr-1) 0.06 0.05 0.04 0.03 Dry Wet • Mean stand age: 94 ± 5.4yrs Moisture class Moisture: F=0.69, P=0.41 Severity: F=4.62. P=0.04 M x S: F=0.19, P=0.67 • Mining N from past fire cycles
0.20 0.15 0.10 0.05 Wet, low Wet, high Dry, low 0.00 Dry, high 0.0 0.1 0.2 0.3 0.4 0.5 N loss versus pre-fire N pool • Dry, high severity sites: R2=0.61, P<0.02 • No support for H2 in wet sites, or low severity dry sites N loss (kg N m-2) • What does predict N loss across sites? • Linear comb. of tree density and drainage class predicted • 20% of variation. Pre-fire N pool (kg N m-2)
Burn severity Low High 110 100 90 80 Rel.N loss (%) 70 60 50 40 30 Dry Wet 20 Moisture Class 10 Moisture n.s. Severity *** M x S n.s. Relative N loss (% of pre-fire N pool) • No support for H1. *** ***
110 100 90 80 70 Rel.N loss (%) 60 50 40 30 20 10 0.0 0.1 0.2 0.3 0.4 0.5 Pre-fire N pool (kg N m-2) Relative N loss versus pre-fire N pool • Reinforces patterns of heterogeneity in N accumulation across the landscape R2=0.64, P<0.001
Summary • Mean N loss from forest floor was 0.08 kg N m-2 . • High severity sites lost more N than low severity sites. • Absolute N loss was positively related to pre-fire N pools, but only in dry, high severity sites. • Relative N loss was negatively related to pre-fire N pool size across all sites.
Conclusions • Substantial N loss mines N accumulated over centuries, even in low severity burns. • Severity reinforces landscape patterns of organic soil layer N accumulation.
Thanks to: • Field crew: Adrienne Frisbee, Laura Gutiarrez, Emily Tissier • Lab crew: Grace Crummer, Jennie DeMaro, Ashley Gordon • Funding: Interagency Joint Fire Sciences Program, Mellon Foundation