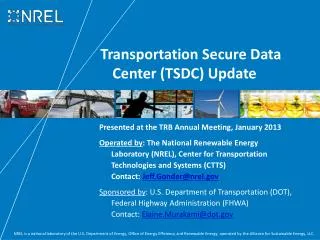
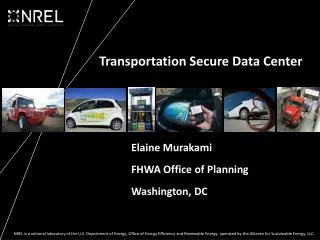
Transportation Secure Data Center
Transportation Secure Data Center. Elaine Murakami FHWA Office of Planning Washington, DC. Agenda. Motivations Different approach to traditional research centers Datasets currently available, examples of analyses Processing steps taken by NREL Data access using VMWare.

Transportation Secure Data Center
E N D
Presentation Transcript
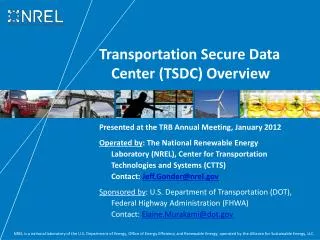
Transportation Secure Data Center Elaine Murakami FHWA Office of Planning Washington, DC
Agenda • Motivations • Different approach to traditional research centers • Datasets currently available, examples of analyses • Processing steps taken by NREL • Data access using VMWare
Transportation Secure Data Center (TSDC) • Goal: Securely archive and provide public access to detailed transportation data • Transportation research has numerous topics of interest, many of which can be explored using GPS devices placed in a vehicle or on a person • Publicly-available GPS-based data sets are rare • Data sets are expensive to collect, and difficult to interpret • Sharing transportation data places participants privacy at risk limiting its distribution
Some of the Data Available through the Secure Controlled Access Portal
Seattle - Puget Sound Traffic Choices (FHWA value pricing project, by PSRC • GPS recording at X per minute; insufficient for drive cycle processing, but still useful for spatial analyses • 447 vehicles • Sampling occurred between November 2004 & April 2006 • 18 month samples Vehicles Average Speed 20-30 mph 30-40 mph 10-20 mph 0-10 mph 40- mph
Puget Sound Traffic Choices: average week, location of vehicle
Using Real World Driving behavior to estimate energy efficiency
Atlanta – Atlanta Regional Commission (ARC) • 1653 vehicles • Sampling occurred between March 2011 & October 2011 • 7 Day samples Vehicles Persons Average Speed 20-30 mph 30-40 mph 10-20 mph 0-10 mph 40- mph • 797 persons • Sampling occurred between March 2011 & September 2011 • 7 Day samples
Linking travel to roadway func class: Roadway electrification study at NREL DRAFT only
Security - Procedures • Establish MOU agreement with data provider • Receive data via mail or secure FTP • Load onto secure raw data handling server • Building badge access • On-site security force • Room key access • Limited to data center staff • Maintain data backups • Data mirrored on large storage array • Regular tape back-up • Fire/disaster protection for copies NREL Data Center Storage Arrays
Data Processing • Two groups of processing routines are available to handle data sets • Six questions to determine how to handle the study: • Is the vehicle GPS sample interval greater than 0.25Hz? • Is study data provided? • Yes - Ask the remaining questions • No - Continue with drive cycle processing • Is vehicle configuration indicated? • Is trip level data analysis available in the original study? • Does the study include a wearable GPS component? • If a wearable GPS component is included is trip level data available? • If vehicle GPS data is above 0.25 Hz it is always fed through drive cycle processing • The study data is handled separately but a link is maintained between NREL results and the original study results
Drive Cycle Processing: Calculations - Results • Calculations • 250+ variables characterizing the vehicle operation over the sequence are generated for each sequence • Filtered point data are used to build trip lines based on the sequences identified • Calculation results are appended to the feature GPS SPEED/LOCATION TRACE 30-45 mph 45-60 mph 15-30 mph 0-15 mph 60-75 mph MICRO-TRIP LINE SEGMENT Line Drawn From Points – Order assigned using time
Additional TSDC Processing • EPA Vehicle Match – Links vehicle configuration data to the EPA database and adds vehicle class(type) • Person Database Update – Assigns an NREL identifier number to each person • Unfiltered Trip Processing - Uses original trip data (start/end times) to sequence raw point data • Applied to both wearable and vehicle trip data when available • Outputs statistics indicating the quality of the data, and builds a line representing the path of travel • Operates on the unfiltered data only
Maintaining the Link • A link is maintained between NREL results and the original study data • All studies use either a single column or at most 2 columns to indicate a vehicle or person • NREL assigns a single unique integer for all vehicles and records the original study’s vehicle identifiers as a single column in the vehicle tables (applies to persons as well) Atlanta Example: • sampno - is the household identifier (800042) • vehno - is the unique vehicle identifier relative to the household (2) • Original vehicle identifier assigned as (800042_2) NREL vehicle identifier assigned (54)
TSDC Master Database • All study data is loaded in a single database • Smaller databases are created for each study and transferred to the TSDC access areas • Study data often includes: • Wearable GPS add-ons • Survey data • Results for the full study
TSDC – Data Access • The TSDC processes data sets and provides access through two areas • Cleansed Download Data Area: A website where anonymized versions of the processed and original data sets are available to the public • Spatial reference and personally identifying information (PII) are removed • www.nrel.gov/tsdc • Secure Portal for Controlled Access: Remote connection to a virtual machine at NREL where users can log on to work with full data sets after completing a simple application process • Controls within the secure environment prevent data removal (e.g., no local drive sharing or external internet connection) • Software tools provided for working with the data • Users may receive aggregated results from their analyses
ACTION steps • Submit YOUR GPS data into the archive • Use data in the archive to understand what you can do with GPS data for your area BEFORE you spend money on a GPS travel survey • Use the archive to support transportation, land use, energy, and emissions research
Thank you! For more information: • Elaine Murakami, FHWA Office of Planning • Elaine.murakami@dot.gov • 206-220-4460 • Jeff Gonder, National Renewable Energy Lab • Jeff_gonder@nrel.gov • 303-275-4462
Chicago – Chicago Metropolitan Agency for Planning • 408 vehicles • Sampling occurred between March 2007 & November 2007 • 7 Day samples Vehicles Average Speed Persons 20-30 mph 30-40 mph 10-20 mph 0-10 mph 40- mph • 209 Persons • Sampling occurred between September 2007 & January 2008 • 7 Day samples
Los Angeles – Southern California Association of Governments Vehicles Average Speed • 626 vehicles • Sampling occurred between June 2001 & March 2002 • 2 day samples 20-30 mph 30-40 mph 10-20 mph 0-10 mph 40- mph