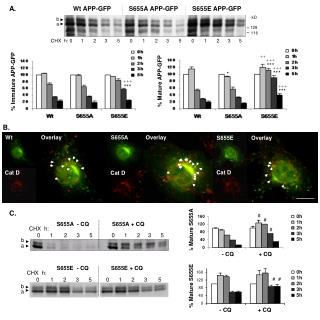
Mature DC
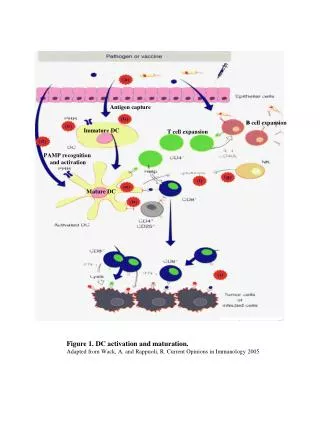
Antigen capture. B cell expansion. Immature DC. T cell expansion. PAMP recognition and activation. Mature DC. Figure 1. DC activation and maturation. Adapted from Wack, A. and Rappuoli, R. Current Opinions in Immunology 2005. Figure 2. Human DC subsets and lineage origins.

Mature DC
E N D
Presentation Transcript
Antigen capture B cell expansion Immature DC T cell expansion PAMP recognition and activation Mature DC Figure 1. DC activation and maturation. Adapted from Wack, A. and Rappuoli, R. Current Opinions in Immunology 2005
Figure 2. Human DC subsets and lineage origins. Shortman, K and Y. J. Liu Nature Reviews Immunology 2002
Figure 3. Within the immune synapse formed between APCs and T cells, three signals are required for antigen-specific T cell activation. Gutcher, I. and Becher, B. Journal of Clinical Investigation 2007
Figure 4. APC-derived cytokines guide the differentiation of naive T cells into an effector T cell subtypes in mouse. Gutcher, I. and Becher, B. Journal of Clinical Investigation 2007
Figure 5. Structures of the IL-1R family. Sims, J. et al Current Opinions in Immunology 2007
Figure 6. TLRs localization and their ligands. Verstak, B. et al Inflammation Research 2007 Table 1. Synthetic and endogenous TLR ligands. Kanzler, H. et al Nature Medicine 2007
Figure 7. IRF Activation by Cytosolic Pattern-Recognition Systems; Operation of a Positive-Feedback Mechanism. Honda, K. et al Immunity 2006
Figure 8. Summary of TLR signaling pathways. Dunne, A. and O’Neill, L. FEBS Letters 2005
TRIF TRIF TBK1 IKKe Figure 9. Type I IFN positive feedback loop. Adapted from Doyle, S. et al, Immunity 2002
Figure 10. Schematic representation of IRF-3 and IRF-7 activation and dimerization by virus-induced phosphorylation. Lin, R. et al. Cellular and Molecular Biology 1999
Figure 11. Enhanceosome formation and IFN-β gene transcription. Kenya, H. et al Immunity 2006
Figure 12. IL-12 family members: composition, receptors and regulatory functions. Adapted fromGoriely, S. and Goldman, M. Transplantation 2007
IL-23 IL-27 Figure 13. Regulatory functions of IL-27. Adapted from Colgan, J. and Rothman, P. Nature Immunology 2006
Figure 14. The classification and structure of the PKC family of isozymes. Kheifets, V. and Mochly-Rosen, D. Pharmacological Research 2007
Figure 15. Model of PKCα phosphorylation. Bornancin, F. and Parker, P.J. Journal of Current Biology 1996
Adapted from TLR3 PKCa IL-12/23p40 IL-23p19 IL-12p35 IL-27p28 Figure 16. Schematic of PKCa activity in TLR3 and TLR4 signaling pathways. Adapted from Akira, S. and Takeda, K. Nature Reviews Immunology 2004