Download
1 / 53
540 likes | 681 Vues
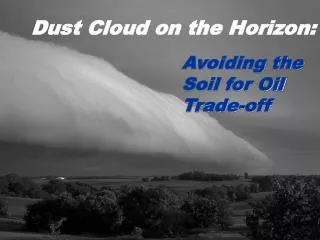
Dust Impacts on the 20% Worst Visibility Days. Vic Etyemezian, David Dubois, Mark Green, and Jin Xu. Improve Sites in 1997 (black) and 2002 (all). Reconstructed Light Extinction Coefficients.

E N D
Dust Impacts on the 20% Worst Visibility Days Vic Etyemezian, David Dubois, Mark Green, and Jin Xu
Reconstructed Light Extinction Coefficients Bext = 3F(RH)[Sulfate] + 3F(RH)[Nitrate] + 4[OMC] + 10[LAC] + 1[Soil] + 0.6[CM]+ 10 (Rayleigh Gas Scattering)
20% Worst Days • After sorting the reconstructed light extinction coefficient values of site X in year Y from lowest to highest, the days with light extinction coefficients above the 80th percentile value are considered 20% worst days in terms of visibility.
For This Presentation • “Dust” = Coarse Mass (CM) + Fine Soil (FS) • “Visibility extinction due to dust” is portion of Bext that is due to CM + FS • Unless otherwise stated, data shown for 1997-2002 • Unless otherwise stated, Bext does NOT include Rayleigh scattering • Some sites have longer record than others
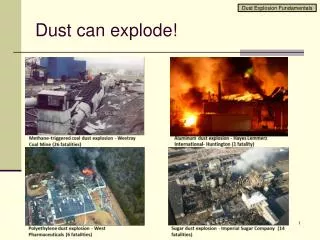
Sources of “Dust” – CM+FS • Regional Windblown • Local Windblown • Road Dust • Construction • Mining • Agriculture • Asian Origin • African Origin • Organic debris • Wildfires • Volcanoes • Sea spray • Other
Fractional Contribution of Dust to Aerosol Extinction For All Worst Days
Absolute Contribution of Dust to Aerosol Extinction For All Worst Days (Mm-1)
Fraction of Worst Days When Dust Contributed 15% or more to Aerosol Extinction
Fraction of Worst Days When Dust Contributed more to Aerosol Extinction than Any Other Component (NO3, SO4, OMC, LAC)
Q1 Q2 Q3 Q4 Seasonal Patterns: Fraction of worst days when dust was principal component of extinction in each quarter.
Asian Dust • During the spring season, the desert regions in Mongolia and China are massive sources of mineral aerosols • Aerosol particles emitted from the Northwest desert region of China may have a significant influence over Eastern Asia, the Northern Pacific and even as far away as North America • Recent work suggests that the frequency of dust storms in China has increased in the last few decades
The Asians Don’t Like It Either Winds in excess of 60 mph can suspend enormous amounts of dust from a very large region
Properties of Asian Dust • Average CM:FS • All 2001 WRAP Worst days caused by dust (except 4/16/01): 4.6 • All WRAP sites when 4/16/01 was worst day: 0.93 • Average K:Fe • 2001 WRAP sites average: 0.91 • 4/16/01 worst day sites: 0.5 • Average Al:Si • 2001 WRAP sites average: 0.2 • 4/16/01 worst day sites: 0.5
Moral of the Story: For this case nothing jumps out immediately as a convincing “most likely” cause of the dust haze in Montruse
Another Resort: Chemistry Example Jarbridge WA Cross-Correlation Plots
Some Things to Think About • Should this Type of Analysis be done for every 20% worst day at every site in WRAP? • OR is there a semi-systematic approach that can be used instead of brute force method? • What types of information can we expect to learn?
Should This Analysis Be Done for Every Worst Day at Every WRAP Site? • # of 20% Worst Site-Days in WRAP Region • Between 1997 and 2003*: 6,839 • Between 2001 and 2003* : 5,838 • Between 2001 and 2003* AND • Dust significant contributor (>15% of Bext): 2,392 • Dust principal contributor (greatest Bext): 899 • *2003 Data Available ~ October, 2004
Should “Episode Analysis” Be Done for Each of the 899 Cases • Analyst can research and document 2 – 4 cases a day • OR ~ 1 – 2 labor years - $$$$. • Not clear that this will result in a useful explanation of “dust” for every case • Will have to be repeated in the future – if desired
Can a semi-systematic, less ambitious, method be used? • Look closely at a subset of worst days with dust as a dominant source • Find commonalities among “like” events and differences between “unlike” events • Use a set of criteria to place all remaining worst days into one of several categories according to “most likely source type”
How can this be done? • Local and Regional Windblown dust • For each site, identify a nearby meteorological station that can provide reasonably representative wind speed data • Look at Wind Speed vs. Coarse Mass to estimate a threshold value for windblown dust at that site • Check if on a particular worst day with dust as dominant haze component • threshold value is exceeded • ratio of Coarse Mass to Fine Soil above a predetermined value • If so, categorize as Windblown Dust
Windblown Dust • 1 site affected – “Local Windblown” dust • Multiple sites affected – “Regional Windblown”
Asian Dust • Tendency to have large regional influence • Compare CM:FS ratio to predetermined value (nominally 1 or less means long-range transport) • Inspect chemical signature (K/FE, Al/Si) • Identify a possible corresponding Asian Dust Event (E.g. Using NRL model) • Inspect air mass trajectories • If all points to Asian origin then “Asian Dust”
Other Sources • Construction: Unless close to monitor, likely infrequent and mixed with urban plume. Difficult to identify unless well-documented • Road Dust: Same as Construction. If from urban source, urban air quality monitors might help. Signature of exhaust might help. • Mining: Is there a mine within one day’s transport of site? Do trajectories show this as possible? Can chemistry be used as a tracer • Agriculture: Could be substantial, depending on season. Difficult to confirm individual event occurrence. E.g. “Did Farm X harvest almond on Date Y?”
Other Sources • African Dust: Can use same approach as Asian dust, though probably very infrequent cause of worst day • Organic debris: Can be related to agriculture. Probably seasonal. Probably shows different CM:FS ratio than windblown • Wildfires, Volcanoes: Were there any wildfires or volcano eruptions nearby? Ratios of FS:Organic, K:FS, CM:FS can help. • Sea Spray: Probably impacts coastal sites (if any in WRAP). Na and Cl content and ratio of CM:FS can help
The “Other” Category • For some cases, multiple sets of criteria would be met • Depending on # of such cases, inspect individually, try to find supplemental information • For some cases, no set of criteria is met satisfactorily • These will go into “Other” category. Can Happen when: • Inadequate met data • Multiple sources in comparable quantities • Criteria set incorrectly • Unforeseen/undocumented source • Just Because
Summary of Method • Consider only 2001-2003 20% worst days in WRAP at sites where dust (CM+FS) is dominant haze constituent • Inspect subset of those days for useful trends to include known days for impacts from major source types • As much as reasonable, place each worst day into category based on defined criteria. # of categories determined by how well the criteria can be defined
What Can We Learn? Pros and Cons of Method • Cons: • Limited to worst days dominated by dust haze • Does not give “source apportionment” for any particular day • Some difficulties likely in determining source category for some worst days • Pros: • A mix of reasoning and brute force - optimize ratio of outcome to resources utilized • Leverages many of the same tools currently used in Causes of Haze Assessment (COHA) • Provides a first stab at a methodology that can be improved in the future • Provides insight into knowledge gaps • Likely to result in accounting for the most frequent causes of dust haze • Can be completed in 1 year or so