Download
1 / 102
1.02k likes | 1.24k Vues
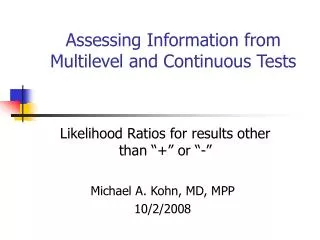
Assessing Information from Multilevel and Continuous Tests . Likelihood Ratios for results other than “+” or “-”. Michael A. Kohn, MD, MPP 10/2/2008. Four Main Points. 1) Dichotomizing a multi-level test by choosing a fixed cutpoint reduces the value of the test.

E N D
Assessing Information from Multilevel and Continuous Tests Likelihood Ratios for results other than “+” or “-” Michael A. Kohn, MD, MPP 10/2/2008
Four Main Points 1) Dichotomizing a multi-level test by choosing a fixed cutpoint reduces the value of the test. 2) The ROC curve summarizes the ability of the test to differentiate between D+ and D- individuals. 3) LR(result) = P(result|D+)/P(result|D-) = slope of ROC curve. (NOTE: Do not calculate an LR(+) or LR(-) for a multilevel test.) 4) Pre-Test Odds x LR(result) = Post-Test Odds
NOTE Do not calculate an LR(+) or LR(-) for a test with more than two possible results.
Additional Topics • Optimal Cutoffs • Walking Man • C Statistic
Example from Chapter 3 65-year-old woman with mammogram suspicious for malignancy Pre-test probability ≈ 0.015 LR(“suspicious for malignancy”) ≈ 100 Post-test probability = ?
Update Pre-Test Probability Using LR(test result) • Convert pre-test probability (P) to pre-test odds. Pre-Test Odds = P/(1-P) • Calculate LR. P(result|D+)/P(result|D-). • Post-Test Odds = Pre-Test Odds × LR • Convert post-test odds to post-test probability. Prob = Odds/(1+Odds)
Update Pre-Test Probability Using LR(test result) 1) Pre-test probability P = 0.015 Pre-test odds = P/(1-P) ≈ 0.015 2) LR(“Suspicious for Malignancy”) = 100 3) Post-Test Odds = 0.015 × 100 = 1.5 4) Post-test probability = Odds/(1+Odds) = 1.5/2.5 = 0.60
Can Use Web-Based Calculator • We will come back to this (This ends the example for Chapter 3.)
Evaluating the Test--Test Characteristics • For dichotomous tests, we discussed sensitivity P(+|D+) and specificity P(-|D-) • For multi-level and continuous tests, we will discuss the Receiver Operating Characteristic (ROC) curve
Using the Test Result to Make Decisions about a Patient • For dichotomous tests, we use the LR(+) if the test is positive and the LR(-) if the test is negative • For multilevel and continuous tests, we use the LR(r), where r is the result of the test
Septic Arthritis Bacterial infection in a joint.
Clinical ScenarioDoes this Adult Patient Have Septic Arthritis?
Clinical ScenarioDoes this Adult Patient Have Septic Arthritis? A 48-year-old woman with a history of rheumatoid arthritis who has been treated with long-term, low-dose prednisone presents to the emergency department with a 2-day history of a red, swollen right knee that is painful to touch. She reports no prior knee swelling and no recent trauma or knee surgery, illegal drug use, rash, uveitis, or risky sexual behavior. On examination, she is afebrile and has a right knee effusion. Her peripheral white blood cell (WBC) count is 11 000/µL and her erythrocyte sedimentation rate (ESR) is 55 mm/h. An arthrocentesis is performed, and the initial Gram stain is negative. You have the synovial white blood cell (WBC) count. Margaretten, M. E., J. Kohlwes, et al. (2007). Jama297(13): 1478-88.
Clinical ScenarioDoes this Adult Patient Have Septic Arthritis? Assume pre-test probability of septic arthritis is 0.38. How do you use the synovial WBC result to determine the likelihood of septic arthritis? Margaretten, M. E., J. Kohlwes, et al. (2007). Jama297(13): 1478-88.
Why Not Make It a Dichotomous Test? Synovial Septic Arthritis WBC Count Yes No >25,000 77% 27% ≤ 25,000 23% 73% TOTAL* 100% 100% *Note that these could have come from a study where the patients with septic arthritis (D+ patients) were sampled separately from those without (D- patients). Margaretten, M. E., J. Kohlwes, et al. (2007). Jama297(13): 1478-88.
Why Not Make It a Dichotomous Test? Sensitivity = 77% Specificity = 73% LR(+) = 0.77/(1 - 0.73) = 2.9 LR(-) = (1 - 0.77)/0.73 = 0.32 “+” = > 25,000/uL “-” = ≤ 25,000/uL
Clinical ScenarioSynovial WBC = 48,000/mL Pre-test prob: 0.38 LR(+) = 2.9 Post-Test prob = ?
Clinical ScenarioSynovial WBC = 48,000/mL Pre-test prob: 0.38 Pre-test odds: 0.38/0.62 = 0.61 LR(+) = 2.9 Post-Test Odds = Pre-Test Odds x LR(+) = 0.61 x 2.9 = 1.75 Post-Test prob = 1.75/(1.75+1) = 0.64
Clinical ScenarioSynovial WBC = 48,000/mLSlide Rule Pre-test prob: 0.38 LR(+) = 2.9 Post-Test prob = (Demonstrate Slide Rule)
Can Use Excel Pre-test prob: 0.38 LR(+) = 2.9 Post-Test prob =
Can Use Web-Based Calculator http://www.quesgen.com/Calculators/PostProdOfDisease/PostProdOfDisease.html P(+|D+) = Sensitivity = 77% P(+|D-) = 1 - Specificity = 1 - 73% = 27%
Clinical ScenarioSynovial WBC = 128,000/mL Pre-test prob: 0.38 LR = ? Post-Test prob =?
Clinical Scenario Synovial WBC = 128,000/mL Pre-test prob: 0.38 Pre-test odds: 0.38/0.62 = 0.61 LR = 2.9 (same as for WBC=48,000!) Post-Test Odds = Pre-Test Odds x LR(+) = 0.61 x 2.9 = 1.75 Post-Test prob = 1.75/(1.75+1) = .64
Why Not Make It a Dichotomous Test? Because you lose information. The risk associated with a synovial WBC=48,000 is equated with the risk associated with WBC=128,000. Choosing a fixed cutpoint to dichotomize a multi-level or continuous test throws away information and reduces the value of the test.
Main Point 1: Avoid Making Multilevel Tests Dichotomous Dichotomizing a multi-level or continuous test by choosing a fixed cutpoint reduces the value of the test
Histogram • Does not reflect prevalence of D+ (Dark D+ columns add to 100%, Open D- columns add to 100%) • Sensitivity and specificity depend on the cutpoint chosen to separate “positives” from “negatives” • The ROC curve is drawn by serially lowering the cutpoint from highest (most abnormal) to lowest (least abnormal).* * Just said that choosing a fixed cutpoint reduces the value of the test. The key issues are 1) the ROC curve is for evaluating the test, not the patient, and 2) drawing the ROC curve requires varying the cutpoint, not choosing a fixed cutpoint.
Margaretten, M. E., J. Kohlwes, et al. (2007). Jama297(13): 1478-88.
Cutoff ≥0 Cutoff > 25k Cutoff > 50k Cutoff > 100k Cutoff > ∞
Test Discriminates Fairly Well Between D+ and D- D+ D- Test Result
Test Discriminates Poorly Between D+ and D- D+ D- Test Result
Area Under ROC Curve Cutoff ≥0 Cutoff > 25k Cutoff > 50k Area Under Curve = 0.8114 Cutoff > 100k Cutoff > ∞
Area Under ROC Curve Summary measure of test’s discriminatory ability Probability that a randomly chosen D+ individual will have a more positive test result than a randomly chosen D- individual
Area Under ROC Curve • Corresponds to the Mann-Whitney U Test Statistic (= Wilcoxon Rank Sum), which is the non-parametric equivalent of Student’s t test. • Also corresponds to the “c statistic” reported in logistic regression models
Main Point 2ROC Curve Describes the Test, Not the Patient • Describes the test’s ability to discriminate between D+ and D- individuals • Not particularly useful in interpreting a test result for a given patient
ROC Curve Describes the Test, Not the Patient Clinical Scenario Synovial WBC count = 48,000 Synovial WBC count = 128,000