Download
1 / 66
660 likes | 766 Vues
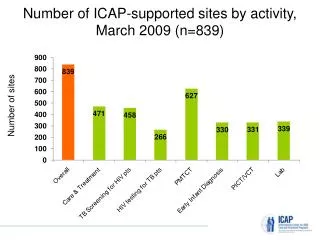
Number of ICAP-supported sites by activity, March 2009 (n=839). Number of sites. Number of ICAP-supported sites by country, March 2009 (n=839). Number of sites. What: Collects program and facility information on ICAP-supported care and treatment programs semi-annually

E N D
Number of ICAP-supported sites by activity, March 2009 (n=839) Number of sites
Number ofICAP-supported sites by country, March 2009 (n=839) Number of sites
What: Collects program and facility information on ICAP-supported care and treatment programs semi-annually Purpose: To describe the scope, diversity, and comprehensiveness of ICAP-supported care and treatment programs, and evaluate multi-level factors that influence program performance and patient-level outcomes Program and Facility Characteristics Tracking System (PFaCTS)
Location and type of ICAP-supported HIV care and treatment sites (n=341) n=149 n=192 % sites
Proportion of ICAP-supported HIV care and treatment sites offering HIV-related services on site (n=341) % sites with service
Proportion of ICAP-supported HIV care and treatment sites offering HIV-related services on site by number of services offered (n=341)
Proportion of ICAP-supported HIV care and treatment sites offering ≥4 HIV-related services on site (n=338) ICAP Average =76% % sites with ≥4 services
Proportion of ICAP-supported HIV care and treatment sites offering on-site patient support services by type of service offered (n=323) % sites with service
Proportion of ICAP-supported HIV care and treatment sites offering on-site patient support services by number of services offered (n=323)
Proportion of ICAP-supported HIV care and treatment sites with ≥4 on-site patient support services (n=241) ICAP Average =45% % of sites with ≥ 4 services
Proportion of ICAP-supported HIV care and treatment sites with access to laboratory assays (n=342) % sites
Proportion of ICAP-supported HIV care and treatment sites with access to laboratory assays by number of assays (n=336)
Proportion of ICAP-supported HIV care and treatment sites with access to key HIV-related laboratory assays (n=342) ICAP Average =98% % sites
Proportion of ICAP-supported HIV care and treatment sites with access to PCR laboratory assays (n=325) ICAP Average =92% % sites
Mean number of full-time health care providers at ICAP-supported HIV care and treatment sites (n=348) Mean number of providers
Mean number of outreach workers at ICAP-supported HIV care and treatment sites (n=183) Mean number of outreach workers
Trend in proportion of ICAP-supported HIV care and treatment sites offering on-site patient support services (n=175) % sites
Trend in proportion of ICAP-supported HIV care and treatment sites offering prevention services(n=71) % sites
Proportion of ART patients in sub-Saharan Africa that initiated ART at an ICAP-supported site, December 2007 % of all patients on ART Sub-Saharan countries where ICAP works
Cumulative enrollment in ICAP-supported HIV care and treatment programs (currently reporting) 436 sites Cote d’Ivoire Swaziland Nigeria, Zambia Number of facilities Number of patients Lesotho, Rwanda S. Africa, Tanzania 613,005 in care Ethiopia Mozambique 298,668on ART
Cumulative pediatric enrollment in ICAP-supported HIV care and treatment programs (currently reporting) 436 sites Cote d’Ivoire Swaziland Nigeria, Zambia 63,364 in care Number of facilities Number of patients Lesotho, Rwanda S. Africa, Tanzania Ethiopia Mozambique 28,031 on ART
Cumulative enrollment in HIV care in ICAP-supported HIV care and treatment programs by country(n=613,005) Cote d’Ivoire Swaziland Zambia Nigeria Lesotho Tanzania Number of patients Kenya Rwanda Ethiopia South Africa Mozambique
Cumulative enrollment on ART at ICAP-supported HIV care and treatment programs by country (n=298,668) Swaziland Zambia Cote d’Ivoire Nigeria Lesotho Tanzania Number of patients Kenya Rwanda Ethiopia South Africa Mozambique
Cumulative person-years on ART at ICAP-supported care and treatment programs, as of March 2009 Cumulative person-years on ART
Cumulative and current enrollment in ART care at ICAP-supported HIV care and treatment programsas of March 2009 (n= 298,668) Cumulative initiating ART Lost to follow up Reported dead Number of patients ART patients retained in care
Cumulative enrollment in ICAP-supported HIV care and treatment programs by ART status, age, and sex, as of March 2009 Total ART enrollment (n=298,668) Total care enrollment (n=613,005) Men 15+ Women 15+ Children <15 Children <15 Men 15+ Women 15+
Proportion of patients ever enrolled in HIV care who initiated ART in ICAP-supported care and treatment programs as of March 2009 % patients initiating ART n=71,370 n=51,169 n=613,005 n=10,073 n=36,875 n=41,916 n= 42,097 n=79,908 n=35,517 n=2,605 n=176,425 n=72,050
Cumulative enrollment in ICAP-supported HIV care and treatment programs by age and sex as of March 2009 n=298,668 n=314,337 n=613,005 % patients
Cumulative HIV care enrollment of women and children in ICAP-supported HIV care and treatment programs as of March 2009 % patients in HIV care n=613,005 n=71,370 n=41,916 n=36,875 n=10,073 n=51,169 n=79,908 n= 42,097 n=2,605 n=35,517 n=72,050 n=176,425
Cumulative ART enrollment by women and children in ICAP-supported HIV care and treatment programs as of March 2009 % patients on ART n=32,227 n=298,668 n=18,096 n=20,399 n=22,989 n= 35,174 n=4,098 n=41,022 n=22,996 n=1,585 n=42,344 n=57,338
Cumulative pediatric HIV care enrollment in ICAP supported HIV care and treatment programs, as of March 2009 n=97 n=6,391 n=4,455 n=7,986 n=3,091 n=3,786 n=15,236 n=1,213 n=9,966 n=5,374 n=63,364 n=5,769 % pediatric patients in HIV care
Cumulative pediatric ART enrollment in ICAP-supported HIV care and treatment programs as of December 2008 n=3,529 n=4,990 n=3,255 n=2,842 n=4,009 n=680 n=1,394 n=2,409 n=58 n=28,031 n=1,405 n=3,460 % pediatric patients on ART
ART initiation among patients eligible for ART in ICAP-supported HIV care and treatment programs, January-March 2009 n=376 n=285 n=5,369 n=3,058 n=1,447 n=3,740 n=680 n=2,720 n=2,002 n=3,230 n=25,366 n=2,115 % patients eligible for ART
ART regimens distributed in ICAP-supported HIV care and treatment programs, January-March 2009
ART regimens distributed to adults in ICAP-supported HIV care and treatment programs, January-March 2009 * In South Africa, D4T-3TC-LPV/r , ZDV-ddl-LPV/r , and ABC-ddl-LPV/r are prescribed as a first-line regimen for pediatric patients.
ART regimens distributed to children in ICAP-supported HIV care and treatment programs, January-March 2009
Proportion of patients with CD4 count at baseline, 6, and 12 months after ART initiation, as of March 2009 % patients with CD4 count n=7,153 10,581 n=5,712 n=7,759 n=22,936 n=9,162 n=7,682 n=26,178 n=97,163
Average median CD4 count at baseline, 6 and 12 months after ART initiation, as of March 2009 CD4 Cell Count (cells/ul)
Change in Median CD4 count (cells/µL) at 6 and12 months of ART, as of March 2009 Change in median CD4 count
Status of ART patients at ICAP-supported HIV care and treatment programs as of March 2009 (n= 298,668) 94.5 per 1,000 person-years 51.7 per 1,000 person-years 5.9 per 1,000 person-years *Includes patients who transferred out while on ART.
Reasons for ART discontinuation in ICAP-supported HIV care and treatment programs as of March 2009 n=7,787 n=5,165 n=65 n=6,520 n=12,335 n=2,577 n=3.202 n=1,861 n=8,540 n=7,083 n=248
Pregnant women counseled and tested inICAP-supported PMTCT programs, as of March 2009 # of Women
Pregnant women counseled and tested inICAP-supported PMTCT programs as of March 2009 % Women
Pregnant women counseled and tested inICAP-supported PMTCT programs over time 1st ANC 83,677 Counseled78,956 Tested 74,330 HIV Positive 5,096 ART Prophylaxis 3,739
Pregnant women counseled and tested inICAP-supported PMTCT programs over time % Women n=38.965 n=83,499 n=83,577 n=33,827 n=50,099 n=59,322 n=60,520 n=67,608 First ANC
Pregnant women counseled and tested inICAP-supported PMTCT programs by country as of March 2009 % Women n=32,835 n=9,545 n=7,504 n=42,577 n=189,701 First ANC n=75,619 n=124,536
Type of ART prophylaxis at ICAP-supported PMTCT programs, as of March 2009 n=22,154 n=2,181 n=10,144 n=738 n=411 n=5,484 n=1,852 n=1,344 % Women
Type of ART prophylaxis at ICAP-supported PMTCT programs, April 2007 – March 2009 n=1,216 n=3,587 n=2,247 n=2,536 n=2,931 n=1,932 n=3,966 n=3,739 % Women