Download
1 / 27
270 likes | 381 Vues
Explore the value of in-situ observations through the Oklahoma Mesonet data network, detailing its impact on water budget determination and climate studies. Learn about the network's comprehensive monitoring system and its role in scientific research.

E N D
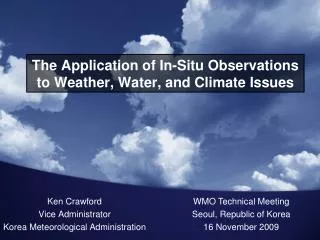
WMO Technical Meeting Seoul, Republic of Korea 16 November 2009 The Application of In-Situ Observations to Weather, Water, and Climate Issues Ken Crawford Vice Administrator Korea Meteorological Administration
This presentation will use in-situ observations from a wide-area network to illustrate their value in determining the water budget of a given locale.(With some technical slides provided by Dr. Jeff Basara from the University of Oklahoma)
Oklahoma’s Weather and Climate network of 120 sites • Deployed across 181,186 km2 and commissioned in 1994 • Joint project between the Oklahoma State University and the University of Oklahoma. • Extensive quality assurance is applied to the collected observations (real-time and archived automated and manual) • Over 4 billion observations archived • Operational funding supplied by the State of Oklahoma – Research funded mainly by grant awards • More than 370 peer-reviewed publications, over 80 M.S. theses, and over 30 Ph.D. Dissertations have used Oklahoma Mesonet data The Oklahoma Mesonet
Every 5 minutes: • Air temperature, 1.5 m, 9 m • Relative humidity, 1.5 m • Rainfall (tipping bucket) • Barometric pressure • Solar, net radiation, 1.8 m • Wind speed/direction, 10 m • Wind speed, 2 m, 9 m • Skin temperature, 1.5 m • Every 15 minutes: • 5 cm soil temp, bare soil, native sod • 10 cm soil temp, bare soil, native sod • 30 cm soil temp, native sod • Every 30 minutes: • 5 cm soil moisture (108 Sites) • 25 cm soil moisture (106 Sites) • 60 cm soil moisture (81 Sites) • 75 cm soil moisture (32 Sites) McPherson, R. A., C. Fiebrich, K. C. Crawford, R. L. Elliott, J. R. Kilby, D. L. Grimsley, J. E. Martinez, J. B. Basara, B. G. Illston, D. A. Morris, K. A. Kloesel, S. J. Stadler, A. D. Melvin, A.J. Sutherland, and H. Shrivastava, 2007: Statewide monitoring of the mesoscale environment: A technical update on the Oklahoma Mesonet. J. Atmos. Oceanic Tech., 24, 301–321. The Oklahoma Mesonet
Linear Relationships Between Root Zone Soil Moisture and Surface Heat Fluxes Basara, J.B., and K.C. Crawford, 2002: Linear relationships between root-zone soil moisture and atmospheric processes in the planetary boundary layer. J. Geophys. Rsch., 107, ACL 10-1-18, 879-884.
Linear Correlation of Sensible and Latent Fluxes With Respect To Soil-Water Content and Soil Depth
The combined impacts of evaporation and transpiration which remove water from the “surface” to the atmosphere. • Requires “energy” for liquid water to change phase to water vapor. • Is highly dependent on solar radiation (sunlight), temperature, wind speed, and ambient humidity. • Is a critical component of the water cycle and may be a source for subsequent precipitation. • Estimated using observed Oklahoma Mesonet observations and the ASCE standardized reference (potential) ET equation (Penmann-Monteith). Evapotranspiration
(Potential ET) The Oklahoma Mesonet - 15 Years
I III IV I II The Oklahoma Mesonet - 15 Years
I I III IV II Phase I – Minimal ET, Limited Precipitation, Soils are Relatively Moist
I I III IV II Phase II – Increasing ET, Increasing Precipitation, Soils Begin to Dry
I I III IV II Phase III – Near Peak ET, Precipitation Significantly Decreases, Soils Dry Rapidly
I I III IV II Phase IV – ET Decreases, Precipitation Increases Slightly, Soils Begin to Recharge
The Diurnal Cycle of Land-Atmosphere Interactions Across Oklahoma’s Winter Wheat Belt M A T T H E W J. H A U G L A N D
What is Oklahoma’s Winter Wheat Belt? Big 12 Champions The Diurnal Cycle of Land-Atmosphere Interactions Across Oklahoma’s Winter Wheat Belt Matt Haugland
What is Evapotranspiration (ET) ? The Diurnal Cycle of Land-Atmosphere Interactions Across Oklahoma’s Winter Wheat Belt Matt Haugland And why is it important? R – G = H + LE (Surface energy balance) Evaporation Transpiration Roots draw soil Moisture up into the plant Increases Latent Heat Flux
Before Harvest – Healthy Wheat Crop The Diurnal Cycle of Land-Atmosphere Interactions Across Oklahoma’s Winter Wheat Belt Matt Haugland • The Winter Wheat Belt is greener than the adjacent counties. • Latent Heat Flux across the WWB is higher (Sensible Heat Flux is lower) • Average high temperatures across the WWB are lower. Visual Greenness (April 2000)
Before Harvest - Average Dewpoint Change The Diurnal Cycle of Land-Atmosphere Interactions Across Oklahoma’s Winter Wheat Belt Matt Haugland March 1994-2000 (0000 – 1300 UTC)
Before Harvest – Ideal Day Dewpoint Change The Diurnal Cycle of Land-Atmosphere Interactions Across Oklahoma’s Winter Wheat Belt Matt Haugland 8 April 2000 (0000 – 1300 UTC)
After Harvest– Bare Soil & Dead Wheat Stubble The Diurnal Cycle of Land-Atmosphere Interactions Across Oklahoma’s Winter Wheat Belt Matt Haugland • The Winter Wheat Belt is less green than the adjacent counties. • Evapotranspiration across the WWB is lower • Sensible heat flux across the WWB is higher Visual Greenness (June 2000)
After Harvest – Average Dewpoint Change The Diurnal Cycle of Land-Atmosphere Interactions Across Oklahoma’s Winter Wheat Belt Matt Haugland June 1994-2000 (2300 – 1100 UTC)
After Harvest – Ideal Day Dewpoint Change The Diurnal Cycle of Land-Atmosphere Interactions Across Oklahoma’s Winter Wheat Belt Matt Haugland 8 June 2000 (2300 – 1100 UTC)
These results: • Provide important, current baselines for many critical variables that impact the water balance of a given locale; • Provide increased understanding of the critical water budget components needed for a comprehensive water plan for Oklahoma; and • Begin to close the gap between our understanding of water as it relates to climate in Oklahoma. • Hopefully, these results also show the great scientific value that in-situ observations offer to those who study weather, water, and climate issues. Summary