Exchange Rate Determination
Exchange Rate Determination. With focus on developing a framework for understanding changes in spot exchange rates. Review of Spot Quote. Go to: http://www.fxstreet.com/

Exchange Rate Determination
E N D
Presentation Transcript
Exchange Rate Determination With focus on developing a framework for understanding changes in spot exchange rates
Review of Spot Quote • Go to: http://www.fxstreet.com/ • Link to Rates and Charts then to Live Currency Rates then link to any quoted pair. Observe the bid and ask prices for this currency pair. • Examine changes in spot rate from standpoint of non-market maker wanting to buy and hold a currency (e.g., euro). • Link to Live Streaming Forex Charts. Link to “Ticks” time scale. • Tick data is the intra-day data stream that records each market transaction (buy or sell) in the market. • Observe how quickly spot rates move.
Observing Moves in Spot Rates • Go to: • http://www.fxstreet.com/ • Link to Live Streaming Forex Charts. • Observe “Candle-Stick” chart type (with time scale 1 minute). • Review meaning of “Candle-Stick” presentation. • When close is higher than the open (indicated by green on FX street) = bullish signal • When close is lower than the open (indicated by red on FX street) = bearish signal
What Determines the Spot Exchange Rate and Causes it to Change? • Demand and Supply Model of Exchange Rates • One approach to the analysis of a possible exchange rate change is through the use of demand and supply models (from macro-economics). • Demand and/or supply shifts will cause the spot (“equilibrium”) rate to change. • This is an approach which is best applied to explain floating exchange rates and to perhaps a lesser degree managed rates. Supply FX Rate Demand Quantity of FX
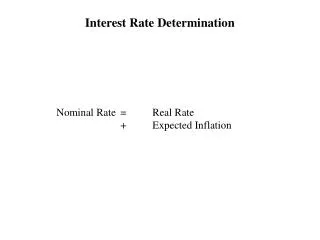
Asset Choice Model • Asset Choice Question: Why do financial markets prefer to hold one currency over another currency? • One Important Factor: Short term returns which can be earned when investing in relatively "risk free” financial assets in each country’s financial markets. • Example (September 14, 2010 data): Australia: 4.66% on 3-month T-bills United States: 0.14% on 3-month T-bills • Analysis: Looking at these interest differentials, which currency will global investors prefer and what will be the impact on the exchange rate between the two currencies?
Interest Rate Differentials and Exchange Rates: GBP/USD, 1990 - 2006
FX Trading Terminology • GBP/USD: Currency pair referred to as the “cable” rate. • PIP: Forex prices are often quoted in tiny increments called pips. A pip refers to the fourth decimal point. Except for the Japanese yen, where pips refer to the second decimal point (This is the only exception among the major currencies). • EUR/USD: 1.2550 to 1.2552; a change of 2 pips. • USD/JPY: bid 85.40 ask 85.44; a spread of 4 pips. • Tick: Consecutive trades and the prices for those consecutive trades. • GBP/USD First tick: 1.5501; second tick (trade): 1.5503: etc… • Long position: Buying a currency and holding it for some period of time in anticipation of the currency strengthening. • Profit if currency appreciates. • Short position: Selling a currency in anticipation of the currency weakening. When it does, buying it back (“covering the short position). • Profit if currency weakens.
Tick by Tick Trades, GBP/USD; September 20, 2010: 4:40 to 4:57pm (FXStreet)
Carry Trade Strategies • Definition: A Carry Trade strategy is a foreign exchange trading strategy which aims to take advantage of both low interest rate and high interest rate countries. Carry trade strategies are used by hedge funds and other traders to take advantage of interest rate differentials. A carry trade strategy involves the following steps: • Borrowing funds from commercial banks in a low interest rate country. These are short term loans and liabilities in the currency of the low interest rate country. • Converting the borrowed money into the currency of the country with the high interest rate. • Investing these funds into short term safe financial assets of the high interest rate country. These are short term financial assets denominated in the currency of the high interest rate country.
Carry Trade Strategy Impacts on Exchange Rates Low Interest Rate Country: When its Currency is Sold in the Forex Market High Interest Rate Country: When its Currency is Bought in the Forex Market
Risk with Carry Trade Strategies Liability Risk Financial Asset Risk Carry trade strategist has an asset (i.e., a T-bill) denominated in the currency of the high interest rate country. Risks: Reinvestment-Risk: Interest rates might fall and thus when maturing securities are reinvested they result in lower returns. Price-Risk: Interest rate might increase and thus the market price of the T-bill will fall (recall the inverse relationship between interest rates and bond prices, resulting in a capital loss on the bond. Note: of the two risk above, reinvestment risk is probably the most critical, as most investments are in short term securities and thus the price risk is minimal. The currency of the high interest rate country may weaken. Thus, reducing the exchange rate adjusted return. • Carry trade strategist has a liability (i.e., a bank loan) denominated in the currency of the low interest rate country. • Risks: • The interest rate might increase (problem if it is a floating rate loan). • Thus, increasing the nominal interest rate on the loan. • The currency of the low interest rate country may strengthen. • Thus, increasing the exchange rate adjusted cost.
Summary of Carry Trade Strategy Transactions Factors which result in increasing carry trade transactions Factors which result in decreasing carry trade transactions A reduction in the interest rate differential between the two carry trade countries, due to: Lower interest rates in the high interest rate country (i.e., the reinvestment risk). Higher interest rates in the low interest rate country. Expectation regarding exchange rates: High interest rate country’s exchange rate expected to depreciate. Low interest rate country’s exchange rate expected to appreciate. • An increase in the interest rate differential between the two carry trade countries, due to: • Higher interest rates in the high interest rate country. • Lower interest rates in the low interest rate country. • Expectation regarding exchange rates: • High interest rate country’s exchange rate expected to appreciate. • Low interest rate country’s exchange rate expected to depreciate.
South African Rand and Carry Trades Background USD/ZAR Exchange Rate • On Wednesday, September 22, 2010, South Africa’s rand rallied to more than 2 1/2-year high against the US dollar, at 6.9815. As shown in the chart to the right, the rand appreciated sharply in 2009 and has recently showed renewed strength. • Carry Trades: In January 2009, the South African Central Bank benchmark rate stood at 11.5% (U.S. rate at 0.0 to 0.25%). Since that time the South African Central Bank as gradually lowered its rate (currently at 6.5%), but the rate differential still favors the rand. • According to Julian Wilson, a trader at Citigroup Inc. in Johannesburg “The dollar has lost a lot of ground. U.S. interest rates are going to be kept lower for much longer, which maintains the interest differential between higher-yield assets and those denominated in dollars.” • Thus, the near-zero interest rates in developed markets have encouraged investors to borrow in these markets and invest in higher- yielding, emerging markets such as South Africa. • According to Bloomberg, “The transactions, known as carry trades, have swelled net foreign purchases of South African assets to 100.8 billion rand ($14.4 billion) this year.”
Safe Haven Financial Assets and Safe Haven Effects • Definition of a Safe Haven Financial Asset: A financial asset or commodity (usually gold) that is favored by investors in times of a global or regional crisis. • Financial assets are generally short term and risk free (i.e., government T-bills or bank deposits) • The United States, Japan and Switzerland are regarded today as the three primary safe haven countries. • Safe Haven Effect: For global investors in “park” funds in safe haven assets they must first purchase the currency of the safe haven country. This will produce upward pressure on the safe haven currency.
Flight to Safety: First Gulf War • Safe Haven Effect: Into the Swiss Franc (CHF) during the early stages of the 1990 Gulf War • August 2, 1990: Iraq Invades Kuwait • August 7, 1990: US forces arrive in Saudi Arabia • Percent Change in CHF against the USD: approximately 10% (mid July – Late Aug).
Changes in the Global Markets Aversion for or Tolerance of Risk • A safe haven effect with specific focus on risk aversion and risk tolerance. • This effect simply relates to the demand shift away from risky asset classes (e.g., stocks or low grade bonds) to less risky asset classes (e.g., high grade government securities). Factors which increase the global market’s aversion against these riskier financial assets will generally result in downward pressures on selected currencies. • The reverse is true when the market’s tolerance for risk increases. • Risk aversion and risk tolerance relates to the market’s assessment and outlook for key global economies. • Relates to incoming financial and economic data which is not in line with market expectations for that data.
News Which Impacts Favorably/Unfavorably on Countries and Their Prospects (i.e., the Efficient Market Response) • Efficient market hypothesis (EMH) is an idea developed in the 1960s by Eugene Fama of the University of Chicago that essentially says that if financial markets are efficient, then prices of financial assets (such as the spot foreign exchange rate for a currency) will reflect and incorporate in their prices all relevant economic, financial, political (etc) information. • Essentially, if financial markets are “informational efficient” then an asset price reflect what is known by market participants about the past, the present, and what is expected to happen in the future. • Expectations then play a role in today’s asset prices, i.e., spot exchange rates. If we assume this is true, then exchange rates will only respond to “unexpected” news or “unexpected” events. • Why? Because expected news and expected events have already been incorporated in the current spot exchange rate.
Central Bank “Unexpected” Announcement Bank of England Raises Interest Rates Reaction of Sterling to the news (GBP/USD spot rate) • On Thursday, January 11, 2007, the Bank of England surprised financial markets by raising their key monetary policy interest rate by 25 basis points to 5.25%. The Bank of England announced in raising the rate the U.K. "The margin of spare capacity in the economy appears limited, adding to domestic pricing pressure.” (i.e., inflation). • Only one of the 50 analysts polled by Reuters had predicted the move, which took borrowing costs to their highest level in 5-1/2 years. • Most had thought the central bank would wait at least another month to see whether wages were heading up in the New Year and for a clearer reading on the consumer sector. • The pound rose dramatically as analysts were caught off guard and said markets were on heightened alert for more moves in the future. • "We're rethinking our interest rate forecasts. The MPC has surprised financial markets twice now within the space of six months and at this juncture it's impossible to rule out another surprise," said Philip Shaw, chief economist at Investec.
Trade Flows Between Countries • Trade flows, and any resulting trade imbalances, between countries can have an effect on exchange rates. The issue with this factor, however, is that the cause – effect relationship can work both ways, i.e., trade flows affecting the exchange rate and in turn the exchange rate affecting trade flows. • Measure of trade flows: • Merchandise trade flows: Refers to exports and imports of merchandise goods. We can also add service flows. • Capital account trade flows: Refers to cross border buying of both financial and real assets.
Trade Flow Impacts on Exchange Rates Deficit Country: Imports > Exports or Capital Outflows > Capital Inflows Surplus Country: Exports > Imports or Capital Inflows > Capital Outflows
Factors Affecting Trade and Capital Flows Trade Flows Capital Flows Relative real returns on financial assets, where the real return is the nominal return minus inflation. Relative real interest rates. Relative real returns on stocks. Relatively high real returns lead to net capital inflows (capital inflows > capital outflows). • Relative rate of inflation. • Relatively high rates of inflation lead to trade deficits (imports > exports) • Relative income levels. • Relatively high income levels leads to trade deficits (imports > exports). • Government policies including: • Tariffs and quotas. • Management of exchange rate: if a country “undervalues” its currency, this can lead to a trade surplus (e.g., China today?) • Product characteristics and demand. • Product substitutes, monopoly suppliers.
Data (1980 – 1986): (1) Exchange Rate: Index of USD against 10 major trading partners (2)Real Interest Rate Differential = Long Term U.S. Real Interest Rate minus a Weighted Average of 10 Foreign Long Term Real Interest Rates Source: Federal Reserve of Kansas City Study, November 1986 Exchange Rates and Real Interest Rates
Impact of Exchange Rate Changes on Trade Flows • Under a floating rate exchange rate system, changes in the exchange rate are assuming to have a lagged effect on a country’s external trade imbalance. • Assume a country’s exchange rate weakens relative to its trading partners. • Under this assumption, that country’s goods become cheaper in those foreign markets and foreign country goods become more expensive. This factor, everything else equal, should move the country’s trade in the direction of a surplus (or greater surplus) as it exports more and imports less. Why do we assume this? • Assume currency A weakens by 5% against currency B (i.e., currency B has strengthened by 5% against currency A). • Country A exporters will now find that Country B’s consumers can now spend 5% less in their currency to purchase Country B’s goods and services. • Country B exporters will now find that Country’s A’s consumers will need to spend 5% more in their currency to purchase Country B goods and services (at Country B prices) • Thus, everything else equal, Country A’s exports to Country B should increase (and/or Country B’s exports to Country A should decrease).
Impact of Exchange Rate Pass Through on Trade Flows • What happens in the real world to a country’s trade balance (exports and imports) depends upon: • The response of global companies to the exchange rate change and their foreign market currency pricing strategy. • Assume the following: • Country B Exporter (a US company) selling a product in Country A (Japan) at a local selling price of 10,000 yen. • Assume the initial exchange rate (USD/JPY) is 100; thus the return to the U.S. exporter in USD is $100. • Now assume the yen weakens by 5% to 105. • At this new exchange rate, the U.S. exporter will have to raise prices to 10,500 yen to maintain the $100 return. • However, Country B Exporter (the US company) may decide to: • (1) Keep their Currency A selling price unchanged at 10,000 and thus absorb the entire negative exchange rate effect. This is called a “full pass through of the exchange rate” and should result in no change in the demand for these goods. • (2) Raise their Currency A selling price less than 5%. This should result in less change in the demand for these goods.
Exchange Rates and Trade Balances: A Complete Picture • Data from 2002 to 2008, shows a pattern in which periods of CAD appreciation alternate with periods where the trade balance increases. • When the trade balance is high, the CAD appreciates (see ). • This may represent the impact of the trade balance on the currency. • However, the appreciation eventually brings the trade balance down (see ). • This may represent the impact of the exchange rate on the trade balance.
Central Bank Decisions and Announcements • Central Bank announcements and decisions, especially as these relative to interest rate target changes, can have substantial impacts on: • (1) the trend of a country’s exchange rate and • (2) short term (perhaps over the course of a day) moves in a country’s exchange rate. • As noted earlier, interest rate impacts can be viewed in terms of the asset choice model or, if unexpected changes, in terms efficient market effects (e.g., see Bank of England, January 11, 2007 announcement).
What Central Bank Interest Rates Should We Follow? • While some central banks use a variety of interest rates depending upon the use of that rate, all have a short term target rate. This target rate is what each central bank uses to affect its country’s financial system, and hence overall economic activity. All of these target rates have specific names as designated by each central bank. For the major central banks, these target rates are as follows: Central BankTarget RateCurrent Rate* • U.S. Central Bank (Federal Reserve): Federal funds rate 0 - .25% • New Zealand: Official cash rate 3.00% • Australia: Overnight cash rate 4.50% • United Kingdom Bank rate 0.50% • Korea Base rate 2.00% • China Base interest rate 5.13% • Canada Overnight rate 1.00% • European Central Bank Main refinancing rate 1.00% • Japan Uncollateralized overnight call rate 0.10% • * Rates as of September 14, 2010 • For current and historical central bank rates and changes link to: http://www.fxstreet.com/fundamental/interest-rates-table/
Interpreting Central Bank Statements FOMC Press Release: September 21, 2010 Market (EUR/USD) Reacts to Possibility of Return to Quantitative Easing • “Information received since the Federal Open Market Committee met in August indicates that the pace of recovery in output and employment has slowed in recent months. Household spending is increasing gradually, but remains constrained by high unemployment, modest income growth, lower housing wealth, and tight credit. Business spending on equipment and software is rising, though less rapidly than earlier in the year, while investment in nonresidential structures continues to be weak. • The Committee will maintain the target range for the federal funds rate at 0 to 1/4 percent and continues to anticipate that economic conditions, including low rates of resource utilization, subdued inflation trends, and stable inflation expectations, are likely to warrant exceptionally low levels for the federal funds rate for an extended period. • The Committee will continue to monitor the economic outlook and financial developments and is prepared to provide additional accommodation if needed to support the economic recovery.” • Interpretation: The central bank did not announce further quantitative easing but warned that is prepared to provide additional accommodation if needed.
Long Term Trend Impact of Interest Rates Changes on Exchange Rate: AUD Australian Central Bank Interest Rate Targets Trend and Trend Changes in AUD • July 2006: 5.00% • August 2006: 6.00% • August 2008: 7.25% (High point) • April 2009: 3.00% (Low point) • February 2010: 3.75% • September 2010: 4.50%
Impact of Foreign Exchange Regime on Exchange Rates • As we noted in an earlier lecture, countries use three types of foreign currency regimes. These regimes influence how a currency’s spot exchange rate is determined and, as we shall see, also have a direct impact on the volatility of a currency’s spot exchange rate. As a quick review, these three regimes are: • (1) Independent float (also called a freely floating regime): This regime allows the private market, through demand and supply shifts, to set the exchange rate. Under this regime, the private market is constantly adjusting the exchange rates as new information comes into the market. What we have examined thus far in this lecture are essentially factors to consider under an independent float regime. • Examples of Independent floating currencies (and year adopted): Canadian dollar (1970), U.S. dollar (1973), British pound (1973), yen (1973), Australian dollar (1985), New Zealand dollar (1985), Euro (1999), Argentina Peso (2002).
Impact of Foreign Exchange Regime on Exchange Rates • (2) Pegged arrangement: This regime sets an exchange rate as determined by a particular country’s government. The exchange rate is allowed to vary within a very small range of the peg as demand and supply conditions change. The government is committed to intervening in foreign exchange markets to prevent the currency from moving outside of its peg range. The currency is not allowed to appreciate or depreciation over time, but instead moves with the range of this peg. The peg is set in relation to a major currency (e.g., the USD) or a basket of currencies. • Example of Pegged currency: Hong Kong dollar, since 1983 (7.8HKD = 1USD) • (3) Managed float: In between an independent float and a pegged arrangement is a managed float, whereby a government will manage its currency’s exchange rate as the private market pushes it one way or the other. Under this arrangement, a currency can still appreciate or depreciate over time, but the daily movement will be managed by the government though intervention. • Examples of Managed float currencies: Singapore dollar, Egyptian pound, Israel shekel, Indian rupee, Chinese Yuan (July 2005 – July 2008; Early 2010 to the present)
Measure of Currency Volatility • Standard deviation: Is a measure of the dispersion or variation in a set of data from the average measure of that data. The greater the standard deviation, the greater the volatility of the data you are looking at. Greater volatility also means greater risk. • See two examples to the right, Assume both have means of 0% (average percent change). • Note: the first example, with its larger spread about the mean, has a greater standard deviation, hence greater volatility. • For reasonably symmetric and bell shaped data sets we can assume: +/- 1 standard deviation contains roughly 68% of the data +/- 2 standard deviations contains roughly 95% of the data +/- 3 standard deviations contains roughly all the data
Impact of Pegged Foreign Exchange Regime on Currency Volatility HKD: SD of Monthly % Changes January 2000 – Sept 2010 = 0.0012% SAR: SD of Monthly % Changes January 2000 – Sept 2010 = 0.0011%
Impact of Managed Foreign Exchange Regime on Currency Volatility CNY: SD of Monthly % Changes July 2005 – July 2008 = 0.00444% SGD: SD of Monthly % Changes January 2000 – Sept 2010 = 0.0121%
Impact of Floating Foreign Exchange Regime on Currency Volatility EUR: SD of Monthly % Changes January 2000 – Sept 2010 = 0.02597% GBP: SD of Monthly % Changes January 2000 – Sept 2010 = 0.02373%
Regime Impacts on Currency Volatility: Summary Table • Pegged Regimes: • HKD 0.0012% • SAR 0.0011% • Managed Float Regimes • CNY 0.00444% • SGD 0.0121% • Independent Float Regime • EUR 0.02597% • GBP 0.02373% • Note: All standard deviations against the USD; Monthly percentage change data January 2000 to September 2010 (except for the CNY, July 2005 to July 2008).
Implications of Regimes for Global Companies and Global Investors • As we have noted, global companies and global investors face exchange rate exposures and exchange rate risk. • The risk that the exchange rate may move against the firm or the investors. • The exchange rate regime will, in part, determine the degree of that risk that the firm and investor faces. • Risk as measured by the potential volatility of the foreign currency the firm or investor is exposed to. • Floating rate regimes pose the greatest potential risk (i.e., greater potential volatility) while pegged regimes the least risk. Managed floats fall in the middle.
Problem with Pegged Regimes • As long as the country maintains its pegged regime, the global firm and global investor is shielded from exchange rate risk. • This is only true for those firms and investors who’s home currency is the “peg-tie” in. • However, peg regimes can change and when they do the exchange rates associated with them change quickly. • This is referred to as regime change risk.
Hong Kong Dollar Peg The Peg: Against the USD (set at 7.8 in 1983) HKD Weakened Against the EUR (not part of the peg)
Reason for Strengthening of the Euro Against the HKD EUR/USD USD and HKD Against the EUR
Impact of Peg Regime Changes Asian Currency Crisis, 1997 Argentina Currency Crisis, 2002