Download
1 / 67
680 likes | 827 Vues
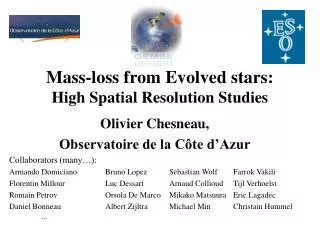
High Resolution Mass Spectrometers role in small molecule studies. TuKiet T. Lam, PhD Chem 395: Bioanalytical Chemistry April 12, 2011. Instrumentations, Fundamental Principles, and Advantages. Various Forms of MS instruments. Aebersold and Mann (2003) Nature 422, 198-207.

E N D
High Resolution Mass Spectrometers role in small molecule studies TuKiet T. Lam, PhD Chem395: BioanalyticalChemistry April 12, 2011
Various Forms of MS instruments Aebersold and Mann (2003) Nature 422, 198-207
Mass Spectrometers ABI ESI QSTAR Elite MS System ABI nano-UPLC ESI QTRAP-4000 MS system Thermo Fisher Scientific nano-UPLC ESI LTQ-Orbitrap MS system ABI API QTRAP 5500 Bruker APEX 9.4 Tesla ESI FT-ICR MS System ABI 4800 MALDI TOF/TOF Tandem MS System Waters CapLC-ESI QTOF Micro MS System
FT-ICR MS Ion Optics --Apollo II Source --Improved sensitivity (>10 x) --Very robust, --Less source Maintenance Apollo II ESI source ECD Heated Glass Capillary Transfer Optics Collision Cell IRMPD Quadrupole
LTQ-FT specs • Resolution • 100 000 resolution at m/z 400 at 1 Hz repetition rate • >500 000 resolution broadband mode • Mass Range • m/z 50-4000 (standard range) • 1-order-magnitude in single scan (e.g. m/z 400-4000) • Mass Accuracy • 2 ppm RMS, external mass calibration • <1 ppm RMS, internal mass calibration • Dynamic Range • >500 000 between mass spectra 5000 within mass spectrum • IRMPD • ECD
Courtesy from David C. Muddiman (Currently at Department of Chemistry at NCSU)
- y z x Why FT-ICR MS? A.G. Marshall, C.L. Hendrickson, and G.S. Jackson. Mass Spectrometry Reviews, 1998, 17, 1-35.
= q B m Once the ion is trapped, So we can calculate the mass of the ion the magnet bends it into We know the a circular path. Magnetic Field B We measure the frequency m “Light” Ions have a High frequency “Heavy” Ions have a Low frequency
Image Current 0.05 Time-Domain Transient 0.04 0.03 Differential Amplifier 0.02 0.01 0 -0.01 -0.02 -0.03 -0.04 -0.05 0 100 200 300 400 500 600 700 800 Time (ms) The signal is recorded for As the spiraling ion gets near a period of time and then a detect plate, it induces a displayed by the software current that is detected by our instrument.
Image Current 0.05 Time-Domain Transient 0.04 0.03 0.02 0.01 0 -0.01 -0.02 -0.03 -0.04 FT -0.05 0 100 200 300 400 500 600 700 800 Time (ms) Frequency Spectrum Mass Spectrum m z A B 2 + = 500 600 700 800 900 1000 1100 1200 1300 1400 0 50 100 150 200 250 300 Frequency (kHz) m/z A Fourier Transform then converts the “time” domain signal into all the frequencies that compose the “time” signal We know how frequency relates to mass, so we convert to the “Mass Spectrum”
25 T 25 T 9.4 T 7 T 9.4 T 7 T 25 25 0 0 B0 (tesla) B0 (tesla) Our experiments get easier at higher magnetic fields Linear increases Highest Non-Coalesced Mass Mass Resolving Power Increase as B2 Scan Speed (LC/MS) Ion Energy Number of Ions Upper Mass Limit Ion Trapping Time 14.5 T 14.5 T
Ion is now trapped in the magnet. + ION Once we make an ion, we move it into the center of the Magnet. Then, we trap it before it can escape. Electrostatic Barrier Ion sees barrier and is turned back “Gate” shut before the ion escapes From Primer 1998 Marshall.
Robust Accurate Mass • 5 ppm rms external calibration • 2 ppm rms internal calibration • High Resolution • 60,000 at m/z 400 with a scan repetition rate of 1 Hz • Maximum Resolution >100,000 • Mass Range • 50-2000; 200-4000 • Sub-fmol Sensitivity (LC/MS) • MS/MS and MSn • High Dynamic Range • >2,500 within mass spectrum
LTQ Orbitrap Operation Principle 1. Ions are stored in the Linear Trap 2. …. are axially ejected 3. …. and trapped in the C-trap 4. …. they are squeezed into a small cloud and injected into the Orbitrap 5. …. where they are electrostatically trapped, while rotating around the central electrode and performing axial oscillation The oscillating ions induce an image current into the two outer halves of the orbitrap, which can be detected using a differential amplifier Ions of only one mass generate a sine wave signal
Ion Motion in Orbitrap • Only an axial frequency does not depend on initial energy, angle, and position of ions, so it can be used for mass analysis • The axial oscillation frequency follows the formula w = oscillation frequency k = instrumental const. m/z = …. what we want! A.A. Makarov, Anal. Chem. 2000, 72: 1156-1162. A.A. Makarov et al., Anal. Chem. 2006, 78: 2113-2120.
Ions of Different m/z in Orbitrap r z φ • Large ion capacity - stacking the rings • Fourier transform needed to obtain individual frequencies of ions of different m/z Electrostatic Field Based Mass Analyser Korsunskii M.I., Basakutsa V.A. Sov. Physics-Tech. Phys. 1958; 3: 1396. Knight R.D. Appl.Phys.Lett. 1981, 38: 221. Gall L.N.,GolikovY.K.,AleksandrovM.L.,PechalinaY.E.,Holin N.A. SU Pat. 1247973, 1986.
Physical Components of Instrument SYNAPT G2 HDMS nanoFlowTMESI APGC ESI/APCI, ESCi(r) APPI, APCI Internal Component of SYNAPT G2 HDMS
MSE Alternating High/Low Energy Acquisition 1 sec MS Precursor MSE Fragments Retention Time
High Definition UPLC/MSE analysis Time Aligned Parallel (TAP) fragmentation CID IMS CID
(Nobel, e-museum) Ionization Methods Nobel Prize in Chemistry 2002 Electrospray Ionization John B. Fenn Matrix Assisted Laser Desorption Ionization (MALDI) Koichi Tanaka
D 430.23262 Deuterated (D) P 430.22835 D D 432.23963 431.23617 P 429.22657 P 430.22990 P 431.23346 Protonated (P) P 429.22623 428 430 432 434 m/z y1 265.04713 (Cal.) z1· 265.04689 (Exp.) m+nHn+ 0.00024 (Diff.) Zoom Rn-1 Rn R1 O O O - 0.9 ppm (Error) H2N C C N C C N C C ... OH 263 264 265 266 267 m/z Facile loss of H3PO4 X-P cleavage preferred ECD Retention of labile modifications No X-P cleavage cn-1 m/z 220 260 300 340 380 IRMPD CID bn-1 Fourier Transform Ion Cyclotron Resonance (FT-ICR) MS Resolution Mass Accuracy Fragmentation Capabilities
(m/z)max - (m/z)min Peak Capacity = m50% m50% m/z (m/z)max (m/z)min Ultra-high Resolving Power
HP-TLC 6 25 1,000 Isocratic LC 12 100 15,000 Gradient LC 17 200 60,000 HPLC 37 1,000 1,500,000 CE 37 1,000 1,500,000 Separation Method Maximum # of Components Maximum Peak Capacity Theoretical Plates Open Tubular GC 37 1,000 1,500,000 ESI FT-ICR MS 525 200,000 60,000,000,000 m/m50% > 200,000 200 < m/z < 1,000 Skip Prior Chemical Separation and Identify Components by MS! maverage +/- 0.25 Da
Zoom Resolving Power (m/z at 609) 609.2821 1,396 610.2754 611.2755 609.2817 2,840 610.2825 611.2790 609.2811 5,682 610.2840 611.2865 22,621 609.2811 610.2847 611.2877 45,094 609.2814 610.2850 611.2877 93,767 609.2818 610.2854 611.2890 607 607 607 607 607 608 608 608 608 608 608 609 609 609 609 609 609 610 610 610 610 610 610 611 611 611 611 611 611 612 612 612 612 612 612 613 613 613 613 613 613 m/z m/z m/z m/z m/z m/z 9.4T Bruker Qe FT-ICR MS
785.8419 R=5901 786.3435 100 R=5900 80 786.8447 60 R=5900 787.3463 40 787.8453 785.5934 R=6000 R=5800 20 R=6200 0 785.8421 786.3434 R=23801 100 R=23900 80 786.8446 60 R=24000 Relative Abundance 787.3457 40 785.5992 787.8471 R=24100 R=15600 20 R=24300 0 785.8419 786.3435 100 R=48101 R=47700 80 786.8446 60 R=48200 787.3458 40 787.8477 785.5994 R=47500 R=42000 20 R=47100 0 785.8413 786.3428 100 R=94801 R=95200 80 786.8442 60 R=93600 787.3458 40 785.5989 787.8477 R=98000 20 R=95800 R=89200 0 785.0 785.2 785.4 785.6 785.8 786.0 786.2 786.4 786.6 786.8 787.0 787.2 787.4 787.6 787.8 788.0 788.2 m/z Resolving Power vs Cycle Time RP 7500 0.2 s RP 30000 0.5 s RP 60000 0.9 s RP 100000 1.6 s
Computing Enhancement with GPU for more complex data set Improvement in performance using a 240-core GPU compared with a quad-core CPU for processing LD/MSE data files of varying file size from different chromatographic Separation.
Measured Theoretical Assignment Error 375.11 375.15 375.19 375.24 375.28 361.23485 361.23548 C20H34O4Na -1.7 ppm # 361.10 361.14 361.19 361.23 361.27 # 375.21416 375.21474 C20H32O5Na -1.6 ppm * * 300 320 340 360 380 400 420 # Peaks of interest * Internal Calibrant * 250 300 350 400 450 500 550 600 650 700 750 800 m/z Johnston, Murray
[M+Na]+ = Exp. 885.4257 ± 0.9 ppm Theo. 885.4249 Quad Select 885 (+1) peak * Broadband with int. cal. * Internal Calibrants * * Bryostatin 2 (+ ion) Quad Select 885 (+1) peak, then IRMPD at 12W 90ms Parent - 44 - 191 - 38 - 32 - 44 - 176 - 88 - 44 - 44 - 18 300 450 600 750 900 150 Manning, Thomas, … Lam, TuKiet, et al., Natural Product Research, 19, 467, (2005).
384-nozzle nanoESI chip Orifice to FT-ICR MS TriVersaNanoMate
RT: 41.57 MS/MS of m/z 598.6 Scan # 4870 0.0 0.5 1.0 1.5 2.0 2..5 RT: 41.58 MS/MS of m/z 547.3 Scan # 4871 RT: 41.59 MS/MS of m/z 974.9 Scan # 4873 Time [sec] RT: 41.60 MS/MS of m/z 1116.5 Scan # 4874 RT: 41.58 MS/MS of m/z 777.4 Scan # 4872 Parallel Detection in Orbitrap and Linear Ion Trap RT: 41.56 High resolution Full scan # 4869 High resolution full scan in Orbitrap and 5 MS/MS in linear ion trap • Total cycle is 2.4 seconds • 1 High resolution scan with accuracies < 5 ppm • External calibration • 5 ion trap MS/MS in parallel
The mass spectrum is obtained for a surface sample from a PEG 4000 treated board on the Vasa’supper gun deck Each peak corresponds to a certain molecular mass. The difference between the major peaks is 44 mass units, which corresponds to one -CH2CH2O- entity (n ± 1) in the PEG chain. The three clusters of peaks with mean values of about 615, 1450 and 3920 mass units show that commercial compounds labelled PEG 600, PEG 1500, and PEG 4000 consist of a distribution of molecules, and that the PEG 600 from inside the board has penetrated into the PEG 4000 surface layer.
PEG: Polyethylene glycol 1031.6 943.6 420.5 899.5 1361.8 855.5 811.5 749.5 1725.0 705.4 470.0 617.4 573.4 2425.4 2234.3 0 400 600 800 1000 1200 1400 1600 1800 2000 2200 2400 m/z
PEG: Polyethylene glycol 1031.6 987.6 1075.7 943.6 1119.7 1141.7 1097.6 899.5 1053.6 1009.6 965.6 925.6 855.5 1152.6 1108.6 811.5 881.5 837.5 1063.6 800 850 900 950 1000 1050 1100 m/z
987.6 943.6 PEG: Polyethylene glycol 965.6 969.6 949.5 993.6 975.5 967.6 953.6 991.6 947.5 984.1 962.0 957.1 979.1 981.6 959.5 946.1 963.5 0 940 945 950 955 960 965 970 975 980 985 990 m/z
Theoretical – 796.0330 Experimental – 796.0344 Error – 1.6ppm Resolving Power ~71,000 656.7787 716.7460 578.8010 483.1826 Zoom Theoretical isotopic distribution of Ruthenium containing compound 898.9883 600 800 1000 1200 1400 1600 m/z *- detectable isotope of molecule of interest W. McNamara; T. Lam; T. Voss 9.4T Bruker Qe FT-ICR MS
351.1336 351.1627 351.1336 351.06 351.10 351.14 351.18 351.22 m/z Zoom 353.1306 352.1370 354.1338 349.1100 349 350 351 352 353 354 355 m/z 356 351.1336 Zoom 293.1755 520.9085 429.1493 609.3397 656.8838 792.8607 -MS, 16.5-16.6min #(865-874) 300 400 500 600 700 800 900 m/z McCarty, K; Lam, TT
Intens. 7 x10 811.12458 1.25 1.00 Deuterated 0.75 0.50 0.25 808.10563 812.12800 0.00 7 x10 6 808.10398 5 4 Protonated 3 2 809.10860 1 0 7 x10 5 808.10538 Mix 4 3 2 1 811.12406 809.10891 0 807 807 807 808 808 808 809 809 809 810 810 810 811 811 811 812 812 812 813 813 813 m/z m/z m/z D. Spiegel; T. Lam 9.4T Bruker Qe FT-ICR MS
Intens. Intens. 7 6 x10 x10 811.12458 1.25 808.10563 1.25 1.00 Deuterated Peak Area 2,047 1.00 Peak Area 18,999 0.75 0.75 0.50 0.50 0.25 0.25 0.00 0.00 5 7 x10 x10 2.5 6 808.10398 2.0 5 Protonated 4 1.5 3 1.0 2 0.5 1 0.0 0 6 7 x10 x10 8 811.12406 5 808.10538 6 Mix (Manual) 4 Peak Area 13,340 Resolution ~473,700 3 4 Resolution ~666,500 Peak Area 62,633 2 2 1 0 0 811.04 811.04 811.04 811.08 811.08 811.08 811.12 811.12 811.12 811.16 811.16 811.16 m/z m/z m/z 808.04 808.04 808.04 808.08 808.08 808.08 808.12 808.12 808.12 808.16 808.16 808.16 m/z m/z m/z 9.4T Bruker Qe FT-ICR MS D. Spiegel; T. Lam
B A Positive Mode B A B Zoom A Negative Mode A A A – Isotopic peaks of Compound 3-hydroxybenzo[a]pyrene B – Isotopic peaks of Compound 3-hydroxybenzo[a]pyrene + H+ 9.4T Bruker Qe FT-ICR MS K. McCarty; T. Lam
Reproducibility of MALDI FTICR at 12T 459.24732 * = peak compared below 701.40696 616.95886 701.40689 770.98423 701.40695 1073.40991 701.40695 * 1260.46798 946.99101 701.40689 701.40701 701.40690 200 400 600 800 1000 1200 1400 m/z DHB_POS_10_M19.d: +MS 701.40701 701.40670 701.40705 701.40 701.45 701.50 701.55 701.60 701.65 m/z DHB_POS_10_M10.d: +MS DHB_POS_10_M11.d: +MS DHB_POS_10_M12.d: +MS DHB_POS_10_M13.d: +MS DHB_POS_10_M14.d: +MS DHB_POS_10_M15.d: +MS DHB_POS_10_M16.d: +MS DHB_POS_10_M17.d: +MS DHB_POS_10_M18.d: +MS DHB_POS_10_M19.d: +MS P. Mistry; M. Easterling; T. Lam
Comparison of Positive and negative MALDI FT-ICR MS of lipid/small molecule for a post treatment patient sera 459.24756 518.32084 812.46106 701.40760 THAP_POS_8_A15.d: +MS 266.94300 1013.64937 1249.73056 1437.77929 THAP_NEG_10_A15.d: -MS 737.10609 547.08271 550.62722 542.26098 551.63059 Zoom 546.35200 548.47723 552.88097 544.33635 547.35530 554.31827 545.30465 552.03578 541.06590 546.07041 543.05142 548.08614 545.06717 547.08271 542 544 546 548 550 552 554 m/z 357.05897 200 400 600 800 1000 1200 1400 m/z P. Mistry; M. Easterling; T. Lam
Hierarchal cluster of Lipid/small molecule from sera of patients pre/post treatment analyzed with MALDI FTICR (THARP matrix) Mass P. Mistry; J. Lee; T. Lam Post-Treatment
Intens. 7 (Isolation and Fragmentation of m/z at 325) x10 5 250.99233 4 3 2 272.97436 142.99257 93.02141 1 117.49194 182.97512 202.04189 227.51176 164.06702 0 7 x10 250.99238 6 4 2 142.99256 93.02141 272.97453 108.32685 164.06712 227.51170 202.04194 0 7 x10 250.99232 4 3 2 272.97431 142.99251 93.02140 1 182.97500 108.32687 239.59321 216.59026 0 100 100 100 120 120 120 140 140 140 160 160 160 180 180 180 200 200 200 220 220 220 240 240 240 260 260 260 280 280 280 m/z m/z m/z 9.4T Bruker Qe FT-ICR MS A. Nassar; T. Lam
780.5535 780.5535 629.1546 758.5718 786.6029 808.5854 828.5522 844.5264 760 770 780 790 800 810 820 830 840 m/z 899.4229 585.2792 539.1089 510.3395 987.1921 1046.2339 500 600 700 800 900 1000 m/z 063010_Araujo_SL1_BB_000001.d: +MS I. Araujo; T. Lam; E. Voss
26 (Δ1.64) 15 (Δ1.33) 11 (Δ1.02) 39 (Δ1.86) 24 Da 24 Da 24 Da I. Araujo; T. Lam; E. Voss