Download
1 / 47
470 likes | 679 Vues
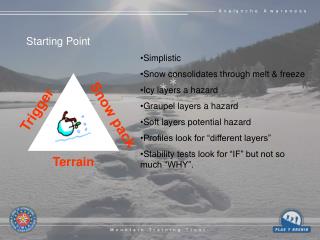
“Analysis is the critical starting point of strategic thinking.”. Payne (3). EXTERNAL ANALYSIS ( INDUSTRY AND COMPETITION). Kenichi Ohmae. Macro Level. Economic. Industry Level. Demographic. Suppliers. Firm. Competitors. Connect. Connect. Social. Global. Substitutes.

E N D
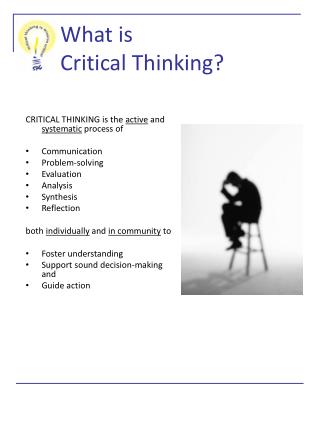
“Analysis is the critical starting point of strategic thinking.” Payne (3) EXTERNAL ANALYSIS (INDUSTRY AND COMPETITION) Kenichi Ohmae
Macro Level Economic Industry Level Demographic Suppliers Firm Competitors Connect Connect Social Global Substitutes Customers Political/Legal Technological Environmental Analysis Levels • EXTERNAL or MACRO-ENVIRONMENT • Industry and competitive conditions (opportunities and threats) • INTERNAL or MICRO-ENVIRONMENT • Its competencies, capabilities, resources, and competitiveness (strengths and weaknesses)
Socio-cultural segment Macro Environment (1) • Women in the workplace • Workforce diversity • Attitudes about quality of worklife • Concerns about environment • Shifts in work and career preferences • Shifts in product and service preferences • Political/Legal Segment • Antitrust laws • Taxation laws • Deregulation philosophies • Labor training laws • Educational philosophies and policies
Macro Environment (2) • Economic segment • Inflation rates • Interest rates • Trade deficits or surpluses • Budget deficits or surpluses • Personal savings rate • Business savings rates • Gross domestic product • Technological Segment • Product innovations • Applications of knowledge • Focus of private and government-supported R&D expenditures • New communication technologies
Global Segment Macro Environment (3) • Important political events • Critical global markets • Newly industrialize countries • Different cultural and institutional attributes • Demographic • Population size • Age structure • Geographic distribution • Ethnic mix • Income distribution
Impact of General Environmental Trends on Various Industries
Five Forces Model of Competition Substitute Products (of firms in other industries) Threat of Substitutes Rivalry Intensity Among Competing Sellers Suppliers of Key Inputs Buyers Bargaining Power of Buyers Bargaining Power of Suppliers Threat of New Entrants Potential New Entrants
Assess strength of each competitive force (Strong? Moderate? Weak? ) Rivalry among competitors Substitute products Potential entry Bargaining power of suppliers Bargaining power of buyers Explain how each force acts to create competitive pressure Decide whether overall competitionis brutal, fierce, strong, normal/moderate, or weak Analyzing the Five Competitive Forces: How to Do It
Usually the most powerfulof the five forces Check which weapons of competitive rivalry are most actively used by rivals in jockeying for position Price Quality Performance features offered Customer service Warranties/guarantees Advertising/promotions Dealer networks Product innovation Rivalry Among Competing Sellers
Lots of firms, more equal in size and capability Slow market growth Industry conditions tempt some firms to go on the offensive to boost volume and market share Customers have low costs in switching brands One or more firms initiates moves to bolster their standing at expense of rivals A successful strategic move carries a big payoff Costs more to get out of business than to stay in Firms have diverse strategies, corporate priorities, resources, and countries of origin What Causes Rivalry to Be Stronger?
Seriousness of threat depends primarily on: Barriers to entry Reaction of existing firms to entry Barriers exist when: Newcomers confront obstacles Economic factors put potential entrant at a disadvantage relative to incumbent firms Competitive Force of Threat of New Entry
Economies of scale Inability to gain access to specialized technology Existence of learning/experience curve effects Strong brand preferences and customer loyalty Capital requirements and/or other specialized resource requirements Cost disadvantages independent of size Access to distribution channels Regulatory policies, tariffs, trade restrictions Common Barriers to Entry
Sales of substitutes are growing rapidly Producers of substitutes are planning to add new capacity Substitutes’ profits are up How to Tell Whether Substitute Products Are a Strong Force The competitive threat of substitutes is stronger when they are: • Readily available • Attractively priced • Believed to have comparable or better performance features • Customer switching costs are low
Substitutesmatter when customers are attracted to the products or services of firms in other industries Competitive Force of Substitute Products Concept Examples • Eyeglasses vs. Contact Lens • MD vs. DPM vs. DC • Plastic vs. Glass vs. Metal
Suppliers are a strongcompetitive force when: Item makes up large portion of product costs, is crucial to production process, and/or significantly affects product quality It is costly for buyers to switch suppliers They have good reputations and growing demand They can supply a component cheaper than industry members can make it themselves They do not have to contend with substitutes Buying firms are not important customers Competitive Force of Suppliers Suppliers are a stronger force the more they can exercise power over: • Prices charged • Quality/performance of items supplied • Amounts and delivery times
Buyers are a strong competitive force when: They are large and purchase a sizable percentage of industry’s product They buy in volume quantities They can integrate backward Industry’s product is standardized Their costs in switching to substitutes or other brands are low They can purchase from several sellers Product purchased does not save buyer money Competitive Force of Buyers Buyers are a stronger competitive force the more they have leverage to bargain over: • Price or Quality or Service • Other terms and conditions of sale
Competitive environment is unattractive when: Rivalry is strong Entry barriers are low Competition from substitutes is strong Suppliers and customers have considerable bargaining power Strategic Implications of the Five Forces • Competitive environment is idealwhen: • Rivalry is moderate • Entry barriers are high • Good substitutes do not exist • Suppliers and customers are in a weak bargaining position • Objective is to craft a strategy that will: • Insulate firm from competitive forces • Influence competitive pressures in ways that favor firm • Build a sustainable competitive advantage
Who are Stakeholders? • Identifying stakeholders is one way of sizing up the internal and external constituents that influence the firm. • Stakeholders are individuals and groups who can affect and are affected by a firm’s strategic outcomes and who have enforceable claims on its performance • Stakeholders include individuals, groups, and other organizations who have an interest in the actions of an organization and who have the ability to influence it • Stakeholders may be categorized as internal, interface and external.
Managing down Relationships with subordinates Managing up Relationships with bosses and corporate staff Managing out Relationships with customers and suppliers Managing across Relationships with peers Building Stakeholder Relationships
Examples of Stakeholder Groups • Internal stakeholders • Management • Professionals • Support Personnel • Interface stakeholders • Shareholders • Board of Directors • Medical Staff • External stakeholders • Suppliers • Competitors • Government Agencies • Patients
Organizations have dependency relationships with stakeholders Firms are not equally dependent on all stakeholders and not every stakeholder has the same level of influence An effective organization strategy requires consensus from a plurality of key stakeholders about what it should be doing and how these things should be done Relationships with Stakeholders
KSFs or CSFs are competitive elements that most affect every strategic group member’sability to prosper in the marketplace: Specific strategy elements Product attributes Resources or Competencies Competitive capabilities KSFsspell difference between: Profit and loss Competitive success or failure Key Success Factors Ask: For our organization to be successful, we MUST be especially good at ___________?
Key Success Factors Optimize Performance A sound strategy incorporates efforts to be competent on allindustry key success factors and to excel on at least one factor!
Answers to three questions pinpoint KSFs On what basis do customers choose between competing brands or offerings of sellers? What must a seller/provider do to be competitively successful -- what resources and competitive capabilities does it need? What does it take for sellers/providers to achieve a sustainable competitive advantage? KSFs consist of the3 - 5 really major determinants of financial and competitive success in a strategic group. (Recall our discussion on developing objectives?) Identifying Key Success Factors
Technology-related Scientific research expertise; Product innovation capability; Expertise in a given technology; Capability to use Internet to conduct various business activities Manufacturing-related Low-cost production efficiency; Quality of manufacture; High use of fixed assets; Low-cost plant locations; High labor productivity; Low-cost product design; Flexibility to make a range of products Distribution-related Strong network of wholesale distributors/dealers; Gaining ample space on retailer shelves; Having company-owned retail outlets; Low distribution costs; Fast delivery Marketing-related Fast, accurate technical assistance; Courteous customer service; Accurate filling of orders; Breadth of product line; Merchandising skills; Attractive styling; Customer guarantees; Clever advertising Skills-related Superior workforce talent; Quality control know-how; Design expertise; Expertise in a particular technology; Ability to develop innovative products; Ability to get new products to market quickly Organizational capability Superior information systems; Ability to respond quickly to shifting market conditions; Superior ability to employ Internet to conduct business; More experience & managerial know-how Other types Favorable image/reputation with buyers; Overall low-cost; Convenient locations; Pleasant, courteous employees; Access to financial capital; Patent protection Common Types of Key Success Factors
High numbers of procedures, which is a component of price, experience, and service. Low rate of complications and high rate of success (20/20) Positive word-of-mouth and reputation Example: KSFs for the Refractive Eye Surgery Industry
Example: KSFs for Beer Industry • Utilization of brewing capacity -- to keep manufacturing costs low • Strong network of wholesale distributors -- to gain access to retail outlets • Clever advertising -- to induce beer drinkers to buy a particular brand
One technique for revealing the different competitive positions of industry rivals is strategic group mapping A strategic group consists of those rivals with similar competitive approaches in an industry Strategic Group Mapping
Firms in same strategic group have two or more competitive characteristics in common . . . Sell in same price/quality range Cover same geographic areas Be vertically integrated to same degree Have comparable product line breadth Emphasize same types of distribution channels Offer buyers similar services Use identical technological approaches Strategic Group Mapping
A Framework of Competitor Analysis High II I Market Commonality III IV Low KEY Low High The shaded area represents degree of market commonality between two firms Resource Similarity Resource endowment A Resource endowment B
Market Commonality is concerned with the number of markets with which a firm and a competitor are jointly involved the degree of importance of the individual markets to each competitor Most industries’ markets are somewhat related in terms of technologies core competencies Multi-market competition Firms competing in several markets Market Commonality
Resource similarity the extent to which the firm’s tangible and intangible resources are comparable to a competitor’s in terms of both type and amount Firms with similar types and amounts of resources are likely to have similar strengths and weaknesses use similar broad strategies Assessing resource similarity can be difficult if critical resources are intangible rather than tangible Resource Similarity
STEP 1: Identify competitive characteristics that differentiate firms in an industry from one another STEP 2: Plot firms on a two-variable map using pairs of these differentiating characteristics STEP 3: Assign firms that fall in about the same strategy space to same strategic group STEP 4: Draw circles around each group, making circles proportional to size of group’s respective share of total industry sales Procedure: Constructing a Strategic Group Map
Example: Strategic Group Map of Retail Jewelry Industry High Small Independent Guild Jewelers National, Regional, & Local Guild - “Fine Jewelry” Stores Prestige Departmentalized Retailers Upscale Department Stores Price / Quality / Image National Jewelry Chains Local Jewelers Medium Chains Credit Jewelers Catalog Showrooms Off-Price Retailers Discounters Outlet Mall Retailers Low Broad-category Retailers Specialty Jewelers Full-line Jewelers Limited-category Retailers Product Line / Merchandise Mix
Variables selected as axes should not be highly correlated Variables chosen as axes should expose bigdifferences in how rivals compete Variables do not have to be either quantitative or continuous Drawing sizes of circles proportional to combined sales of firms in each strategic group allows map to reflect relative sizes of each strategic group If more than two good competitive variables can be used, several maps can be drawn Guidelines: Strategic Group Maps
Driving forces and competitive pressures often favor some strategic groups and hurt others – such recognition may be the key to developing a competitive advantage. Profit potential of different strategic groups varies due to strengths and weaknesses in each group’s market position. Important niches may be identified that are not currently being filled by competitors. The closer strategic groups are on map, the stronger the competitive rivalry among member firms tends to be (“Organizations most like yours are the most dangerous.”) Interpreting Strategic Group Maps(i.e., Implications of the Strategic Groups Concept)
Within or Between Strategic Groups High Price / Quality / Image Medium Low Broad-category Retailers Specialty Full-line Providers Limited-category Retailers Product Line / Merchandise Mix
The World Automobile Industry High Ferrari Lamborghini Porsche Mercedes* BMW Toyota Ford General Motors Chrysler* Honda Nissan Price Hyundai Kia High Low Low Breadth of Product Line
Strategic Groups Within the World Petroleum Industry INTERNATIONAL UPSTREAM COMPANIES INTEGRATED OIL MAJORS INTERNATIONAL UPSTREAM, REGIONALLY FOCUSED DOWNSTREAM Premier Oil Apache Dana Petroleum Kuwait Petroleum PDVSA INTEGRATED DOMESTIC OIL COMPANIES • NATIONAL • PRODUCTION • COMPANIES Iran NOC 0 0.5 1.0 1.5 2.0 Statoil BP-Amoco Exxon -Mobil Vertical Balance Chevron Texaco Pemex Petronas INTEGRATED INTERNATIONAL MAJORS Royal Dutch -Shell Gp. Lukoil Conoco Phillips ENI Elf-Fina-Total Repsol YPF PetroChina Indian Oil Phillips Petrobras ENI Nippon INTERNATIONAL DOWNSTREAM OIL COMPANIES Repsol Valero Neste Ashland Sunoco 0 10 20 30 40 50 60 70 80 NATIONALLY-FOCUSED DOWNSTREAM COMPANIES Geographical Scope
Competitor Analysis and Strength Assessment • Successful strategists take great pains in scouting competitors • Understanding their strategies • Watching their actions • Evaluating their vulnerability to driving forces and competitive pressures • Sizing up their resource strengths and weaknesses and their capabilities • Trying to anticipate rivals’ next moves
A firm’s own best strategic moves are affected by: Current strategies of competitors Actions competitors are likely to take next Predicting rivals’ next moves involves: Analyzing their current competitive positions Examining public pronouncements about what it will take to be successful in industry Gathering information from grapevine about current activities and potential changes Studying past actions and leadership Determining who has flexibility to make major strategic changes and who is locked into pursuing same basic strategy Predicting Strategic Moves of Rivals
Competitive Scope Strategic Intent Market Share Objective Competitive Position Strategic Posture Competitive Strategy Categorizing the Objectives and Strategies of Competitors • Local • Be dominant leader • Aggressive expansion via acquisition & internal growth • Getting stronger; on the move • Mostly offensive • Striving for low-cost leadership • Regional • Overtake industry leader • Well-entrenched • Mostly defensive • Mostly focusing on a market niche • National • Be among industry leaders • Expansion via internal growth • Stuck in the middle of the pack • Combination of offensive & defensive • Pursuing differentiation based on • Quality • Service • Technology superiority • Breadth of product line • Image & reputation • More value for the money • Other attributes • Multi-country • Move to top 10 • Expansion via acquisition • Going after a different position • Aggressive risk-taker • Global • Move up a notch in rankings • Hold on to present share • Struggling; losing ground • Conservative follower • Maintain current position • Give up present share to achieve short-term profits • Retrenching to a position that can be defended • Just survive
1. List industry key success factors and other relevant measures of competitive strength 2. Rate firm and key rivals on each factor using rating scale of 1 - 10 (1 = weak; 10 = strong) 3. Decide whether to use a weighted or unweightedrating system 4. Sum individual ratings to get overall measure of competitive strength for each rival 5. Determine whether the firm enjoys a competitive advantage or suffers from competitive disadvantage Assessing a Company’s Competitive Strength versus Key Rivals
Unweighted Competitive Strength Assessment KSF/Strength Measure ABC Co. Rival 1 Rival 2 Rival 3 Rival 4 Quality/product performance 8 5 10 1 6 Reputation/image 8 7 10 1 6 Manufacturing capability 2 10 4 5 1 Technological skills 10 1 7 3 8 Dealer network/distribution 9 4 10 5 1 New product innovation 9 4 10 5 1 Financial resources 5 10 7 3 1 Relative cost position 5 10 3 1 4 Customer service capability 5 7 10 1 4 Overall strength rating 61 58 71 25 32 Rating Scale: 1 = Very weak; 10 = Very strong
A Weighted Competitive Strength Assessment KSF/Strength Measure Weight ABC Co. Rival 1 Rival 2 Rival 3 Rival 4 Quality/product performance 0.10 8/0.80 5/0.50 10/1.00 1/0.10 6/0.60 Reputation/image 0.10 8/0.80 7/0.70 10/1.00 1/0.10 6/0.60 Manufacturing capability 0.10 2/0.20 10/1.00 4/0.40 5/0.50 1/0.10 Technological skills 0.05 10/0.50 1/0.05 7/0.35 3/0.15 8/0.40 Dealer network/distribution 0.05 9/0.45 4/0.20 10/0.50 5/0.25 1/0.05 New product innovation 0.05 9/0.45 4/0.20 10/0.50 5/0.25 1/0.05 Financial resources 0.10 5/0.50 10/1.00 7/0.70 3/0.30 1/0.10 Relative cost position 0.35 5/1.75 10/3.50 3/1.05 1/0.35 4/1.40 Customer service capability 0.15 5/0.75 7/1.05 10/1.50 1/0.15 4/1.60 Sum of weights 1.00 Overall strength rating 6.20 8.20 7.00 2.10 2.90 Rating Scale: 1 = Very weak; 10 = Very strong