Download

1 / 33
470 likes | 916 Vues
CHAPTER 3 Evaluating a Company’s External Environment. Team A+ 2003054026 Jang, Sunwoo 200900266 Rodolphe Assier 2005034030 Kim, Sumin 2006034031 Kim, Sangmin 2007033083 Yu, Bobae. Thinking about Company’s situation.

E N D
CHAPTER 3Evaluating a Company’s External Environment Team A+ 2003054026 Jang, Sunwoo 200900266 Rodolphe Assier 2005034030 Kim, Sumin 2006034031 Kim, Sangmin 2007033083 Yu, Bobae
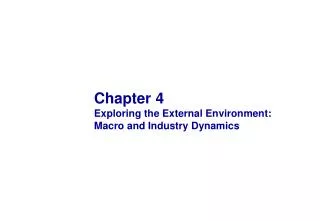
The strategically relevant components of a company’s external environment Company’s macro environment all relevant factors & influences outside the company’s boundaries Relevant influences can sometimes impact on company’s business situation, direction, & strategy. ex) Cigarette company : antismoking ordinances Motor vehicle company : fuel mileage, gasoline prices Drug company : longer life expectancies
Company’s industry & competitive environment Task is much more focused
Q1.What are the industry’s dominant economic features? Economic features are defined by such factors as market size & growth rate. the number & sizes of buyers & sellers the geographic boundaries of the market the pace of technological change the extent of vertical integration cf.) Table 3.1 – Textbook When an industry is characterized by important learning/experience curve effects, industry members are strongly motivated to adopt volume increasing strategies to capture the resulting cost-saving economies and maintain their competitiveness
Q.2 Is the industry competitively attractive or unattractive? The Five-Forces Model of competition
Competitive rivalry within an industry >>An ongoing and dynamic confrontation Threat of New entrance Bargaining Power of Buyers Threat of Substitute product Bargaining Power of suppliers >size of the pool. >whether the Candidates face High or low Entry barriers >Influence the Terms and Condition of Supply. >Industry Members-suppliers collaboration >Negotiate Favorable terms >Strategic Partnerships >available and attractive Price. >the buyer Substitute image. >the cost that Buyers incur in Switching to The substitutes. Text 1 Text 2 Text 3 Text 4
Rivalry among competitive sellers • Rivalry is generally stronger when: • Competing seller are active in making fresh moves to improve their market standing and business performance. • Buyer demand is growing slowly • Buyer demand falls off and sellers find themselves with excess capacity and/or inventory. • The number of rivals increases and rivals are of roughly equal size and competitive capability. • Buyer costs to switch brands are low. • The products of rival sellers are commodities or else weakly differentiated. • One or two rivals have powerful strategies and other rivals are scrambling to stay in the game.
Rivalry among competitive sellers • Rivalry is generally weaker when: • Industry members move only infrequently or in a nonaggressive manner to draw sales and market share away from rivals. • Buyer demand is growing rapidly. • The products of rival sellers are strongly differentiated and customer loyalty is high. • Buyer costs to switch brands are high. • They are fewer than 5 sellers or else so many rivals that any one company’s actions have little direct impact on rivals’ business.
Threat of new entrance • Entry threats are generally stronger when: • The pool of entry candidates is large and some have resources that would make them fomidable market contenders. • Entry barriers are low or can be readily hurdled by the likely entry candidates • When existing industry members are looking to expand their market reach by entering product segments or geographic areas where they currently do not have a presence. • Newcomers can expect to earn attractive profits. • Buyer demand is growing rapidly. • Industry members are unable to strongly contest the entry of newcomers.
Threat of new entrance • Entry threats are generally weaker when: • The pool of entry candidates is small. • Entry barriers are high. • Existing competitors are struggling to earn healthy profits. • The industry’s outlook is risky or uncertain. • Buyer demand is growing slowly or is stagnant • Industry members will strongly contest the efforts of new entrants to gain a market foothold.
Threat of substitute products • Competitive pressures from substitute products are generally stronger when: • Good substitutes are readily available or new ones are emerging. • Substitutes are attractively priced. • Substitutes have comparable or better performance features. • End users have low costs in switching to substitutes. • End users grow more comfortable with using substitutes.
Threat of substitute products • Competitive pressures from substitute products are generally weaker when: • Good substitutes are not readily available or don’t exist. • Substitutes are higher priced relative to the performance they deliver. • End users have high costs in switching to substitutes.
Bargaining Power of suppliers • Supplier bargaining power is generally stronger when: • Industry members incur high costs in switching their purchases to alternative suppliers. • Needed inputs are in short supply (which gives suppliers more leverage in setting prices). • A supplier has differentiated input that enhances the quality or performance of sellers’ products or is a valuable or critical part of sellers’ production process. • There are only a few suppliers of a particular input. • Some suppliers threaten to integrate forward into the business of industry members and perhaps become a powerful rival.
Bargaining Power of suppliers • Supplier bargaining power is generally weaker when: • The item being supplied is a commodity, that is, an item readily available from many suppliers at the going market price. • Seller switching costs to alternative suppliers are low. • Good substitute inputs exist or new ones emerge. • There is a surge in the availability of supplies. • Industry members account for a big fraction of suppliers’ total sales and continued high volume purchases are important to the well-being of suppliers. • Industry members are a threat to integrate backward into the business of suppliers and to self-manufacture their own requirements. good morning
Bargaining Power of buyers • Buyer bargaining power is generally stronger when: • Buyer switching costs to competing brands or substitute products are low. • Buyers are large and can demand concessions when purchasing large quantities. • Large volume purchases by buyers are important to sellers. • Buyer demand is weak or declining. • There are only a few buyers • Identity of buyers adds prestige to the seller’s list of customers. • Quantity and quality of information available to buyers improves.
Bargaining Power of buyers • Buyer bargaining power is generally weaker when: • Buyers purchase the item infrequently or in small quantities. • Buyer switching costs to competing brands are high. • There is a surge in buyer demand that creates a seller’s market. • A seller’s brand reputation is important to a buyer. • A particular seller’s product delivers quality or performance that is very important to buyer and that is not matched in other brands. • Buyer collaboration or partnering with selected sellers provides attractive win-win opportunities.
Q3. what forces are driving industry change and what impacts will they have? How the industry Landscape will Be altered Driving industry participants Driving forces
Driving forces 1. Change in the long term industry growth rate 2. Increasing globalization 3. Emerging new Internet capabilities and applications 4. Change in who buy the product and how they use it 5. Product innovation 6. Technological change and manufacturing process innovation. 7. Marketing innovation
Driving forces 8. Entry or exit of major firms 9. Diffusion of technical know-how across more companies and more countries 10. Change in cost and efficiency 11. Growing buyer preferences for differentiated products 12. Reductions in uncertainty and business risk 13. Regulatory influences and government policy change 14. Changing societal concerns, attitudes, and lifestyles
Driving forces analysis • 1)identifying what the driving forces are • 2)assessing whether the drivers of change are, on the whole, acting to make the industry more or less attractive • 3)determining what strategy changes are needed to prepare for the impacts of the driving forces.
Making strategy adjustments to take the impact of the driving Forces into account • driving forces has practical value and is basic to the task of thinking strategically about where the industry is headed and how to prepare for the anticipated changes.
Q4. What market positions do rivals occupy, who is strongly positioned and who is not? • Strategic group mapping : very useful tool for comparing the market positions of each firm separately or grouping them into like positions
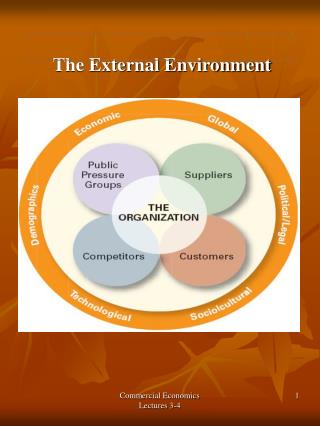
Using strategic group maps to assess the market positions of key competitors Strategic group's composition : competitor in the industry & positions in market guidelines for mapping the positions▼ 1) The two variables selected as axes for the map should not be highly correlated 2) the variables chosen as axes for the map should expose big differences in how rivals position themselves to compete in the markets. 3) the variables used as axes don't have to be either quantitative or continuous 4) drawing the sizes of the circles on the map proportional to the combined sales of the firms 5) it is advisable to experiment with different pairs of competitive variables
What can be learned from strategic group maps? • recognize close competitors and which are distant competitors. • In strategic position map, all positions are not always mean equal attractive position.
High Price / Performance / Reputation Low Few Models Many Models Model Varity (compact, full-size, SUVs, trucks)
Q5. what strategic moves are rivals likely to make next? Identifying Competitor’s Strengths and Weaknesses
Q6. what are the key factors for future competitive success? Common types of industry Key Success Factors
Q.7 Does the outlook for the industry offer the company a good opportunity to earn attractive profits?
summary 1 What are the industry’s dominant economic features 2 What kinds of competitive forces are industry members facing, And how strong is each force 3 What forces are driving changes in the industry, and What impact will these changes have on competitive Intensity and industry profitability 4 What market positions do industry rivals occupy
summary 5 What strategy moves are rivals likely to make next? 6 What are the key factors for future competitive success? 7 Dose the outlook for the industry present the company With sufficiently attractive prospects for profitability? Conclusion