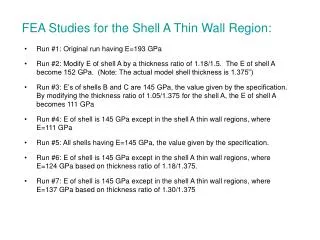
FEA Studies for the Shell A Thin Wall Region:
180 likes | 301 Vues
This study presents a series of Finite Element Analysis (FEA) runs conducted on Shell Type A, exploring the effects of varying the Elastic Modulus (E) and thickness ratios. The initial run established E at 193 GPa, with subsequent modifications examining different thickness ratios leading to E values of 152 GPa, 111 GPa, 124 GPa, and 137 GPa. Stress plots for each run illustrate the response of Shell A under different conditions, highlighting key differences in behavior between thin wall regions and the rest of the shell. All findings contribute to understanding the mechanical performance of modular coil systems.

FEA Studies for the Shell A Thin Wall Region:
E N D
Presentation Transcript
FEA Studies for the Shell A Thin Wall Region: • Run #1: Original run having E=193 GPa • Run #2: Modify E of shell A by a thickness ratio of 1.18/1.5. The E of shell A become 152 GPa. (Note: The actual model shell thickness is 1.375”) • Run #3: E’s of shells B and C are 145 GPa, the value given by the specification. By modifying the thickness ratio of 1.05/1.375 for the shell A, the E of shell A becomes 111 GPa • Run #4: E of shell is 145 GPa except in the shell A thin wall regions, where E=111 GPa • Run #5: All shells having E=145 GPa, the value given by the specification. • Run #6: E of shell is 145 GPa except in the shell A thin wall regions, where E=124 GPa based on thickness ratio of 1.18/1.375. • Run #7: E of shell is 145 GPa except in the shell A thin wall regions, where E=137 GPa based on thickness ratio of 1.30/1.375
Stresses in Shell Type A for Run No. 1 - E=193 GPa Stress Plot up to 120MPa
Stresses in Shell Type A for Run No. 2 - E(A)=152 GPa, E(B&C)=193 GPa Stress Plot up to 110MPa
Stresses in Shell Type A for Run No. 3 - E(A)=111 GPa, E(B&C)=145 GPa Stress Plot up to 110MPa
Modulus of Elasticity in Shell Type A for Run No. 4, No. 6 and No.7 In the pink regions, E = 145 GPa In the brown regions, E=111 GPa Left View Right View
Stresses in Shell Type A for Run No. 4 - E=145 GPa except E(thin wall region)=111 GPa Stress Plot up to 120MPa
Stresses in Shell Type A for Run No. 5 - E=145 GPa
Stresses in Shell Type A for Run No. 6 - E=145 GPa except E(thin wall region)=124 GPa
Stresses in Shell Type A for Run No. 7 - E=145 GPa except E(thin wall region)=137 GPa
Coil Type A Axial Stresses in Modular Coils for Run No. 1 - E=193 GPa Top View
Coil Type A Axial Stresses in Modular Coils for Run No. 2 - E=(B&C)193 GPa, E(A)=152 GPa Top View
Coil Type A Axial Stresses in Modular Coils for Run No. 3 - E=(B&C)145 GPa, E(A)=111 GPa Top View
Coil Type A Axial Stresses in Modular Coils for Run No. 4 - E=145 GPa except E(thin wall region)=111 GPa Top View
Coil Type A Axial Stresses in Modular Coils for Run No. 5 - E=145 GPa
Coil Type A Axial Stresses in Modular Coils for Run No. 6 - E=145 GPa except E(thin wall region)=124 GPa
Coil Type A Axial Stresses in Modular Coils for Run No. 7 - E=145 GPa except E(thin wall region)=137 GPa
Summary: Shell Type A Coil Type A All Coils Max. Disp. Max. Seqv. Max. Disp. Max. Sz. Max. Disp. Max. Sz (mm) (MPa) (mm) (MPa) (mm) (MPa) Run #1 0.980 168 1.246 239 2.711 239 Run #2 1.184 159 1.451 244 2.816 244 Run #3 1.434 152 1.837 256 3.019 256 Run #4 1.168 161 1.517 248 2.971 248 Run #5 1.170 160 1.513 248 2.934 248 Run #6 1.169 161 1.516 249 2.984 249 Run #7 1.170 161 1.515 248 2.997 248