Download

1 / 190
1.9k likes | 2.14k Vues
ECG SIGNAL RECOGNIZATION AND APPLICAITIONS. NSF Project. 12 Lead ECG Interpretation. Anatomy Revisited. RCA right ventricle inferior wall of LV posterior wall of LV (75%) SA Node (60%) AV Node (>80%) LCA septal wall of LV anterior wall of LV lateral wall of LV

E N D
ECG SIGNAL RECOGNIZATION AND APPLICAITIONS NSF Project
Anatomy Revisited • RCA • right ventricle • inferior wall of LV • posterior wall of LV (75%) • SA Node (60%) • AV Node (>80%) • LCA • septal wall of LV • anterior wall of LV • lateral wall of LV • posterior wall of LV (10%)
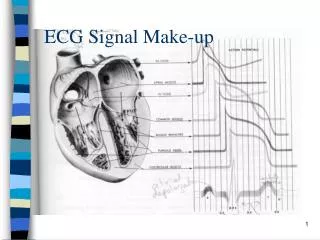
Anatomy Revisited • SA node • Intra-atrial pathways • AV node • Bundle of His • Left and Right bundle branches • left anterior fascicle • left posterior fascicle • Purkinje fibers
Bipolar Leads • 1 positive and 1 negative electrode • RA always negative • LL always positive • Traditional limb leads are examples of these • Lead I • Lead II • Lead III • View from a vertical plane
Unipolar Leads • 1 positive electrode & 1 negative “reference point” • calculated by using summation of 2 negative leads • Augmented Limb Leads • aVR, aVF, aVL • view from a vertical plane • Precordial or Chest Leads • V1-V6 • view from a horizontal plane
Waveform Components: R Wave First positive deflection; R wave includes the downstroke returning to the baseline
Waveform Components: Q Wave First negative deflection before R wave; Q wave includes the negative downstroke & return to baseline
Waveform Components:S Wave Negative deflection following the R wave; S wave includes departure from & return to baseline
Waveform Components:QRS • Q waves • Can occur normally in several leads • Normal Q waves called physiologic • Physiologic Q waves • < .04 sec (40ms) • Pathologic Q • >.04 sec (40 ms)
Waveform Components:QRS • Q wave • Measure width • Pathologic if greater than or equal to 0.04 seconds (1 small box)
Waveform Components:QS Complex Entire complex is negatively deflected; No R wave present
Waveform Components:J-Point Junction between end of QRS and beginning of ST segment; Where QRS stops & makes a sudden sharp change of direction
Waveform Components: ST Segment Segment between J-point and beginning of T wave
Lead Groups I aVR V1 V4 II aVL V2 V5 III aVF V3 V6 Limb Leads Chest Leads
Inferior Wall • II, III, aVF • View from Left Leg • inferior wall of left ventricle V1 V2 V3 V4 V5 V6 I II III aVR aVL aVF
Inferior Wall • Posterior View • portion resting on diaphragm • ST elevation suspect inferior injury I II III aVR aVL aVF V1 V2 V3 V4 V5 V6 Inferior Wall
Lateral Wall • I and aVL • View from Left Arm • lateral wall of left ventricle I II III aVR aVL aVF V1 V2 V3 V4 V5 V6
Lateral Wall • V5 and V6 • Left lateral chest • lateral wall of left ventricle I II III aVR aVL aVF V1 V2 V3 V4 V5 V6
Lateral Wall • I, aVL, V5, V6 • ST elevation suspect lateral wall injury I II III aVR aVL aVF V1 V2 V3 V4 V5 V6 Lateral Wall
Anterior Wall • V3, V4 • Left anterior chest • electrode on anterior chest I II III aVR aVL aVF V1 V2 V3 V4 V5 V6
Anterior Wall • V3, V4 • ST segment elevation suspect anterior wall injury I II III aVR aVL aVF V1 V2 V3 V4 V5 V6
Septal Wall • V1, V2 • Along sternal borders • Look through right ventricle & see septal wall I II III aVR aVL aVF V1 V2 V3 V4 V5 V6
Septal • V1, V2 • septum is left ventricular tissue V4 V5 V6 I II III aVR aVL aVF V1 V2 V3
Axis Deviation&Bundle Branch Blocks • Review of Leads • EKG Leads • EKG machines record the electrical activity • Bipolar limb leads and augmented limb leads [I,II,III, aVR,aVL,aVF] comprise the FRONTAL PLANE LEADS • Records the electrical activity of the hearts frontal plane and are measured from the top of the heart to the bottom of the heart [ right to left ] Understanding 12 Lead EKG
Review of Leads • EKG Leads, continued • EKG machines record the electrical activity. • Precordial leads or chest leads [ V1, V2, V3, V4, V5, V6 ] view the hearts horizontal plane • The heart acts as a central point of the cross section and the electrical current flows from the central point out to each of the V leads Understanding 12 Lead EKG
12-Lead View in perspectives Axis Deviation Bundle Branch Blocks Understanding 12 Lead EKGS
The Hexaxial Reference System • It is divided into positive and negative sections • The direction of the left arm starts at 0 degrees and continues clockwise in 30 degree increments until it reaches 180 degrees • It then begins to measure in the negative range until it returns to 0 BRADY: Understanding 12 Lead EKGS Ch. 14
The Hexaxial Reference System • It is utilized to calculate the exact axis of the heart • In the emergent situation, the exact degree of axis is less important then determining the presence of any deviation in the axis BRADY: Understanding 12 Lead EKGS Ch. 14
Axis Deviation • Terms: • Vector : a mark or symbol used to describe any force having both magnitude and direction; the direction of electrical currents in cardiac cells that are generated by depolarization and repolarization • The currents spread from the endocardium outward to the epicardium BRADY: Understanding 12 Lead EKGS Ch. 14
Axis Deviation • Lead axis : the axis of a given lead • Mean QRS axis : the mean [average] of all ventricular vectors is a single large vector with a mean QRS axis, usually pointing to the left and downward BRADY: Understanding 12 Lead EKGS Ch. 14
Axis Deviation • Axis deviation – alteration in normal flow of current that represents an abnormal ventricular depolarization pathway and may signify death or disease of the myocardium BRADY: Understanding 12 Lead EKGS Ch. 14
Axis Deviation • Axis deviation – Mean axis most commonly flows from top to bottom or right to left • Mean axis commonly flows to a point of +30 degrees • When heart is enlarged, or due to disease or death of muscle, conduction pattern is altered or deviated = axis deviation Understanding 12 Lead EKGS
Axis Deviation • Right Axis deviation- Deviation is between +90 degrees and + or – 180 degrees • Lead 1 = - QRS deflection • Lead aVF = + QRS deflection Understanding 12 Lead EKGS
Axis Deviation • Left Axis deviation– Deviation is between 0 and – 90 degrees • Lead 1 = + QRS deflection • Lead aVF = - QRS deflection Understanding 12 Lead EKGS
Axis Deviation • Extreme right or indeterminate Axis deviation – Deviation is between - 90 and + or – 180 degrees • Lead 1 = - QRS deflection • Lead aVF = - QRS deflection Understanding 12 Lead EKGS
Axis Deviation • Normal Axis • Lead 1 = + QRS deflection • Lead aVF = + QRS deflection Understanding 12 Lead EKGS
Axis deviation may be caused by: • Right Axis Deviation • COPD • Pulmonary embolism • Congenital heart disease • Pulmonary hypertension • Cor pulmonale • Left Axis Deviation • Ischemic heart disease • Systemic hypertension • Aortic stenosis • Disorders of left ventricle • Aortic valvular disease • Wolff-Parkinson-White syndrome Understanding 12 Lead EKGS
Bundle Branch Blocks • Right Bundle Branches • Runs down right side of interventricular septum and terminates at papillary muscles • Functions to carry electrical impulses to the right ventricle • Left Bundle Branches • Shorter then the right bundle branch • Divides into pathways that spread throughout the left side of the interventricular septum and throughout the left ventricle • Two main divisions are called fascicles Understanding 12 Lead EKGS
Bundle Branch Blocks • Normal Conduction • Impulse travels simultaneously through the right bundle branch and left bundle branch • Causing depolarization of interventricular septum and left and right ventricles Understanding 12 Lead EKGS
Bundle Branch Blocks • When one bundle branch is blocked: • Electrical impulse will travel through intact branch and stimulate ventricle supplied by that branch • Ventricle effected by blocked or defective bundle branch is activated indirectly • There is a delay caused by this alternate route • QRS complex will represent widening beyond usual time interval of 0.12 sec • Classified as either complete [ QRS measures0.12 sec or greater ] or incomplete blocks [ QRSmeasures between 0.10 and 0.11 second] Understanding 12 Lead
Right Bundle Branch Block Understanding 12 Lead EKGS
Left Bundle Branch Block Understanding 12 Lead EKGS
Clinical Significance of Bundle Branch Blocks • 15% to 30% of patients experiencing MI in conjunction with new-onset bundle branch blocks may develop complete block and estimated 30% to 70% may develop cardiogenic shock • Cardiogenic shock carries an 85% mortality rate • To determine presence of new-onset block, must have access to past 12-lead EKGs Understandin12 Lead EKGS
Right Bundle Branch Block with normal axis Understanding 12 Lead EKGS
Left Bundle Branch Block with left axis deviation Understanding 12 Lead EKGS
Right Bundle Branch Block with normal axis deviation Understanding 12 Lead EKGS
Left Bundle Branch Block with left axis deviation Understanding 12 Lead EKGS
ECG Rhythm Interpretation Sinus Rhythms and Premature Beats
Arrhythmias • Sinus Rhythms • Premature Beats • Supraventricular Arrhythmias • Ventricular Arrhythmias • AV Junctional Blocks