ECG SIGNAL RECOGNIZATION AND APPLICAITIONS
1.09k likes | 1.32k Vues
ECG SIGNAL RECOGNIZATION AND APPLICAITIONS. ECE, UA. 12 Lead ECG Interpretation. Anatomy Revisited. RCA right ventricle inferior wall of LV posterior wall of LV (75%) SA Node (60%) AV Node (>80%) LCA septal wall of LV anterior wall of LV lateral wall of LV posterior wall of LV (10%).

ECG SIGNAL RECOGNIZATION AND APPLICAITIONS
E N D
Presentation Transcript
Anatomy Revisited • RCA • right ventricle • inferior wall of LV • posterior wall of LV (75%) • SA Node (60%) • AV Node (>80%) • LCA • septal wall of LV • anterior wall of LV • lateral wall of LV • posterior wall of LV (10%)
Unipolar Leads • 1 positive electrode & 1 negative “reference point” • calculated by using summation of 2 negative leads • Augmented Limb Leads • aVR, aVF, aVL • view from a vertical plane • Precordial or Chest Leads • V1-V6 • view from a horizontal plane
Waveform Components: R Wave First positive deflection; R wave includes the downstroke returning to the baseline
Waveform Components: Q Wave First negative deflection before R wave; Q wave includes the negative downstroke & return to baseline
Waveform Components:S Wave Negative deflection following the R wave; S wave includes departure from & return to baseline
Waveform Components:QRS • Q waves • Can occur normally in several leads • Normal Q waves called physiologic • Physiologic Q waves • < .04 sec (40ms) • Pathologic Q • >.04 sec (40 ms)
Waveform Components:QRS • Q wave • Measure width • Pathologic if greater than or equal to 0.04 seconds (1 small box)
Waveform Components:QS Complex Entire complex is negatively deflected; No R wave present
Waveform Components:J-Point Junction between end of QRS and beginning of ST segment; Where QRS stops & makes a sudden sharp change of direction
Waveform Components: ST Segment Segment between J-point and beginning of T wave
Lead Groups I aVR V1 V4 II aVL V2 V5 III aVF V3 V6 Limb Leads Chest Leads
Review of Leads • EKG Leads • EKG machines record the electrical activity. • Precordial leads or chest leads [ V1, V2, V3, V4, V5, V6 ] view the hearts horizontal plane • The heart acts as a central point of the cross section and the electrical current flows from the central point out to each of the V leads Understanding 12 Lead EKG
12-Lead View in perspectives Axis Deviation Bundle Branch Blocks Understanding 12 Lead EKGS
Arrhythmias • Sinus Rhythms • Premature Beats • Supraventricular Arrhythmias • Ventricular Arrhythmias • AV Junctional Blocks
Rhythm #1 • Rate? 30 bpm • Regularity? regular • P waves? normal • PR interval? 0.12 s • QRS duration? 0.10 s Interpretation? Sinus Bradycardia
Sinus Bradycardia • Deviation from NSR - Rate < 60 bpm
Rhythm #2 • Rate? 130 bpm • Regularity? regular • P waves? normal • PR interval? 0.16 s • QRS duration? 0.08 s Interpretation? Sinus Tachycardia
Sinus Tachycardia • Deviation from NSR - Rate > 100 bpm
Premature Beats • Premature Atrial Contractions(PACs) • Premature Ventricular Contractions(PVCs)
Rhythm #3 • Rate? 70 bpm • Regularity? occasionally irreg. • P waves? 2/7 different contour • PR interval? 0.14 s (except 2/7) • QRS duration? 0.08 s Interpretation? NSR with Premature Atrial Contractions
Premature Atrial Contractions • Deviation from NSR • These ectopic beats originate in the atria (but not in the SA node), therefore the contour of the P wave, the PR interval, and the timing are different than a normally generated pulse from the SA node.
Rhythm #4 • Rate? 60 bpm • Regularity? occasionally irreg. • P waves? none for 7th QRS • PR interval? 0.14 s • QRS duration? 0.08 s (7th wide) Interpretation? Sinus Rhythm with 1 PVC
PVCs • Deviation from NSR • Ectopic beats originate in the ventricles resulting in wide and bizarre QRS complexes. • When there are more than 1 premature beats and look alike, they are called “uniform”. When they look different, they are called “multiform”.
Ventricular Conduction Normal Signal moves rapidly through the ventricles Abnormal Signal moves slowly through the ventricles
Wisdom (Knowledge + experience) Knowledge (Information + rules) Information (Data + context) Data The Data Pyramid Value How can we improve it ? What made it that unsuccessful ? Volume What was the lowest selling product ? How many units were sold of each product line ?
Data Mining Functions Clustering into ‘natural’ groups (unsupervised) Classification into known classes;e.g. diagnosis (supervised) Detection of associations; e.g. in basket analysis: ”70% of customers buying bread also buy milk” Detection of sequential temporal patterns;e.g. disease development Prediction or estimation of an outcome Time series forecasting
Data Mining Techniques (box of tricks) Statistics Linear Regression Visualization Cluster analysis Older, Data preparation, Exploratory Decision trees Rule induction Neural networks Abductive networks Newer, Modeling, Knowledge Representation
Data-based Predictive Modeling Develop Model WithKnown Cases Use Model For New Cases 1 2 IN OUT IN OUT F(X) Attributes, X Diagnosis, Y Rock Properties Attributes (X) Diagnosis (Y) Y = F(X) Determine F(X)
Data-based Predictive Modeling by supervised Machine learning • Database of solved examples (input-output) • Preparation: cleanup, transform, add new attributes... • Split data into a training and a test set • Training: Develop model on the training set • Evaluation: See how the model fares on the test set • Actual use: Use successful model on new input data to estimate unknown output
S S S The Neural Network (NN) Approach HiddenLayer Input Layer Output Layer Neurons .6 Age 34 Actual: 0.65 .4 .2 0.60 .5 .1 Gender 2 .2 .3 .8 .7 4 .2 Stage Error: 0.05 Transfer Function Weights Weights Dependent Output Variable Independent Input Variables (Attributes) Error back-propagation
Medicine revolves on Pattern Recognition, Classification, and Prediction Diagnosis: Recognize and classify patterns in multivariate patient attributes Therapy: Select from available treatment methods; based on effectiveness, suitability to patient, etc. Prognosis: Predict future outcomes based on previous experience and present conditions
Need for Data Mining in Medicine Nature of medical data: noisy, incomplete, uncertain, nonlinearities, fuzziness Soft computing Too much data now collected due to computerization (text, graphs, images,…) Too many disease markers (attributes) now available for decision making Increased demand for health services: (Greater awareness, increased life expectancy, …) - Overworked physicians and facilities Stressful work conditions in ICUs, etc.
Medical Applications • Screening • Diagnosis • Therapy • Prognosis • Monitoring • Biomedical/Biological Analysis • Epidemiological Studies • Hospital Management • Medical Instruction and Training
Diagnosis and Classification • Assist in decision making with a large number of inputs and in stressful situations • Can perform automated analysis of: - Pathological signals (ECG, EEG, EMG) - Medical images (mammograms, ultrasound, X-ray, CT, and MRI) • Examples: - Heart attacks, Chest pains, Rheumatic disorders - Myocardial ischemia using the ST-T ECG complex - Coronary artery disease using SPECT images
Diagnosis and Classification ECG Interpretation R-R interval SV tachycardia QRS amplitude QRS duration V entricular tachycardia AVF lead L V hypertrophy R V hypertrophy S-T elevation Myocardial infarction P-R interval
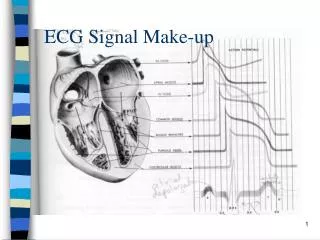
Outline Biological Problem Heart Physiology ECG ventricular repolarization Simultaneously ventricular activation (depolarization) Sequential atrial activation (depolarization) After depolarizations in the ventricles
Outline Biological Problem Difference In Wave Shape And Frequency : ECG wave shape characterization REGULAR RHYTHM Normal IRREGULAR RHYTHM Arrhythmia P ,T AND U WAVE INDISTINCT. IRREGULAR RHYTHM Ventricular Arrhythmia REGULARRHYTHM Bradycardia
Outline The Algorithm: time domain statistics
d range Signal derivative in initial condition point Number of Samples for Trajectors Minimum Distance between Trajectories 0 Signal derivative at the starting point Number of couples of trajectories Three Initial Conditions d0 range Outline Minimum Distance between trajectories The Algorithm Input Parameters
d 2 d 1 d 3 d Totale Discrete Map #1 Discrete Map #2 Discrete Map #3 j j j j Total Matrix of Difference Matrix of Difference #2 Matrix of Difference #1 Matrix of Difference #3 Outline The Algorithm From Discrete Map to dj
Outline Parametric Study Initial Condition In P-wave choose the points in order to extractcoherent trajectories
Outline Parametric Study Extraction of dj parameters From points in P-wave extract dj that have asymptotic behaviour and present limited oscillation
d j Results Results Trend of dj dj have a similar trend for the three cases but with different value. Normal Arrhythmia Ventricular Arrhythmia Initial Slope
Ventricular Arrhythmia Best proportionality between |d∞ | and λ Arrhythmia Normal Results Results (d∞ - λMAX) vs Power2 | |
Operator Dependent Neural Network for P-wave recognition Automatic search of initial conditions Algoritm of Automatic clustering for 3D graphics Initial conditions obtained by visual inspectionon the P-wave 2 1 Outline Future Development Possible Solution
The study of the d∞ and the LyapunovExponent are performed simultaneously Outline Conclusions The asymptotic distance between trajectories,d∞, has been obtained from computation ofdj dj trend is similar to one reported in literature on Chaotic System Need more medical statistics and inputs! Theoretical study Application healthy Biomedical Application: Automatic Diagnostic unhealthy
Attribute Selection: Information Gain • Select the attribute with the highest information gain • Let pi be the probability that an arbitrary tuple in D belongs to class Ci, estimated by |Ci, D|/|D • Expected information (entropy) needed to classify a tuple in D: • Information needed (after using A to split D into v partitions) to classify D: • Information gained by branching on attribute A