Download
1 / 36
360 likes | 517 Vues
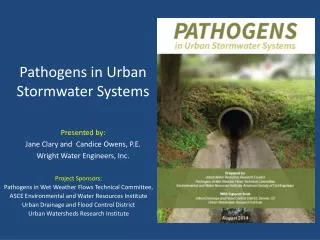
Pathogens in Urban Stormwater Systems. Presented by: Jane Clary and Candice Owens, P.E. Wright Water Engineers, Inc. Project Sponsors: Pathogens in Wet Weather Flows Technical Committee, ASCE Environmental and Water Resources Institute Urban Drainage and Flood Control District

E N D
Pathogens in Urban Stormwater Systems Presented by: Jane Clary and Candice Owens, P.E. Wright Water Engineers, Inc. Project Sponsors: Pathogens in Wet Weather Flows Technical Committee, ASCE Environmental and Water Resources Institute Urban Drainage and Flood Control District Urban Watersheds Research Institute
Overview • Basic regulatory background • Sources of FIB in urban areas • Predicting fate and transport • Monitoring and source tracking • Statistical analysis • Source controls • Structural controls • TMDL case studies • Research needs • And 40 pages of references
The Problem Top 10 Causes of Impairment in U.S. by # of 303(d) Listings • Most strains of E. coli and enterococci do not cause human illness (that is, they are not human pathogens); rather, they indicate the presence of fecal contamination. • Many of these listings are not due to sewage (untreated, CSO, or SSO). Source: EPA http://iaspub.epa.gov/waters10/attains_nation_cy.control?p_report_type=T#tmdl_by_pollutant Accessed May 2012,
EPA’s 2012 Recreational Water Quality Criteria A few highlights: • Removes use intensity considerations at beaches. • No national-level exclusion for natural sources. • Tools for developing alternative RWQC on a site-specific basis (e.g., QMRA). • Tools for assessing and managing recreational waters, such as predictive modeling and sanitary surveys. • New rapid method for enterococci using qPCR method (helpful for beaches). • Frequency of Exceedances: 0 for geomean & < 10% for STV • Duration: 30- day assessment period
Health Risk from Different Fecal Sources (EPA 2012 RWQC) • “Human pathogens are often present in animal fecal matter, and thus, there are risks associated with recreating in animal-impacted waters.” • “..quantifying that level of risk associated with animal fecal material is difficult, and the methods necessary to distinguish between human and nonhuman fecal sources, with the appropriate level of confidence, are still under development.” • “EPA is not developing recommendations that take source of fecal contamination into account.” • “…human health risk associated with exposure to waters impacted by animal sources can vary substantially. In some cases these risks can be similar to exposure to human fecal contamination, and in other cases, the risk is substantially lower.” • “…states interested in adopting different standards to address the variability in human health risks associated with different sources of fecal contamination on a site-specific basis should refer to methods for developing site-specific standards [in the new criteria].
Implications for Urban Areas Stormwater Managers/MS4s • MS4 permit holders must address issue due to TMDLs • FIB elevated in urban runoff • Storm sewer system can be a source during dry weather, too
Bacteria in Urban Runoff(Research by Pitt, Maestre and Wilson) • Ubiquitously high—regardless of land use • Absence of first-flush effect • Look for new analyses from NSQD
Dry Weather Urban Runoff: Enterococci for Residential and Commercial Land Uses in San Diego County (Source: Weston 2009a)
Secondary/Environmental Sources • Biofilms • Instream • In storm sewers • Sediment • Decaying plants/organic matter • Soils
Source Identification • Traditional FIB analysis • Other source fingerprinting techniques • Advance molecular methods Based on Recommendations in Griffith et al. 2013
Why is Modeling Bacteria so Difficult? • Biotic and abiotic factors affect survival • Sediment resuspension Source: Olivieri et al., in WERF 2007
International Stormwater BMP Databasewww.bmpdatabase.org • Statistical analysis updated April 2012 • Includes new statistical characterizations • Hypothesis testing • FIB data set has grown • E. coli • Fecal coliform • Enterococcus • Still important to caveat findings based on # studies & # events
BMP Performance: E. coli • End of pipe limits are unlikely to be consistently met. • Volume reduction can help to reduce loads.
General Conclusions Related to BMP Performance • Data set remains limited for most BMP category-FIB combinations. • Results to date do not support consistent attainment of numeric effluent limits for FIB in stormwater at end of pipe. • Retention (wet) ponds and media filters appear to provide best performance on a density/concentration basis. • Bioretention and other infiltration-oriented practices can reduce bacteria loads by reducing frequency and volume of runoff. • Disinfection works at point of outfall, but not realistic in many contexts. • Some BMP types appear to export bacteria.
Nebraska Case Study: Cost Estimates for E. coli TMDL • 7.7 sq. mi. Antelope Creek Watershed, Lincoln • Source load estimates by land use & BMP evaluation using WinSLAMM • Curb-cut bioretention retrofits identified as a key BMP • Est. Cost: $57 million over 40-year plan ($7.4M/sq. mi.) • City will start w/ source controls and pilot projects using 5-year plans
San Diego River, California Comprehensive Load Reduction Plan
Estimated TMDL Implementation Plan Costs for the Ballona River TMDL (Source: City of Beverly Hills et al. 2009)
New and Improved Source Identification Tools Candice Owen, P.E.
Source Tracking - Bacteroidales Using a Bacteria Source Tracking “Toolkit” • Anaerobic enteric bacteria • Limited persistence • Limited re-growth • Highly abundant in intestines/feces • Genetic differences specific to host • Use qPCR to quantify… results in in gene copies/100 mL
Advanced Methods in Source Tracking • Microbial Source Tracking methods • Quantitative Microbial Risk Assessment (QMRA)
Source Tracking Flow Chart Courtesy Brandon Steets, GeosyntecConsultants In Pathogens in Urban Stormwater Systems
Which human or non-human sources are most prevalent stormwater discharges? What outfalls display the highest levels of these sources? How can these conclusions aid in the implementation of more effective bacteria BMPs? Which areas drain to the most “problematic” stormwater outfalls? What questions can microbial source tracking answer? Use a “weight of evidence” approach to answers the following questions:
MST Example: Horse Race Track • Blamed gulls for bacteria issues • 3 wet weather events • Used “weight of evidence” • Determined sources were primarily equine
QMRA QMRA – Quantitative Microbial Risk Assessment • Multi-step approach that couples risk assessment principles with statistical computations to estimate consequences of possible exposure to infectious organisms • Watershed-specific data is input • Monte Carlo statistical modeling approach to account for variability
QMRA Flow Chart Step 3 Exposure Step 1 Context Step 2 Hazards Step 5 RISK SPIN! Step 4 Health Effects Step 6 Policy
What questions can QMRA answer? • What pathogens are useful to monitor in stormwater and natural runoff? • What pathogens are most prevalent and likely to cause illness? • What are the risks to people recreating in the study waters? • How can we mitigate risk?
Example: 2011 WERF QMRA Study • 3 regions of the US • 7 discharges of concern • Toolkit of bacteria, viruses and protozoa • Risks highest for Norovirus and rotavirus. Highest in agricultural and CSO samples. Risk was highest for children.
In Closing, We Still Need: A national policy-level dialogue regarding regulatory options that are protective of human health, while recognizing practical economic constraints facing local governments: • a. What level of control for FIB is practical and attainable, and reflects “acceptable” levels of public health protection based on actual pathogenicity and exposure? • b. How can measurable water quality compliance metrics (e.g., for TMDLs, MS4 permits) be expressed so that practical constraints are recognized, while still promoting meaningful water quality improvement?
Download Report Here: : http://collaborate.ewrinstitute.org/home Jane Clary, Wright Water Engineers clary@wrightwater.com Candice Owen, P.E., Wright Water Engineers cowen@wrightwater.com