Download
1 / 44
520 likes | 882 Vues
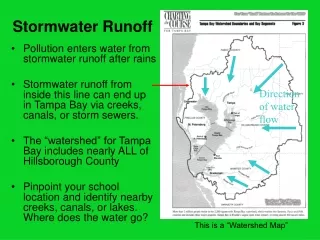
Stormwater and Urban Runoff. Hydrology – study of the properties, distribution, and circulation of the earth’s water

E N D
Stormwater and Urban Runoff • Hydrology – study of the properties, distribution, and circulation of the earth’s water • Our Interest – understanding and predicting patterns in the loads (i.e., flow rates) of water at specified locations so that we can safely, efficiently, and productively manage it (divert it, control its release to aquifers or surface flows, etc.) • Focus on rainfall-runoff relationship (snowmelt-runoff also important but beyond our scope)
Rainfall Patterns and Fates • Spatial domain of interest – watershed (catchment or drainage area; ‘drainage basin’ includes area that contributes underground flow) • Rainfall patterns • Typically characterized by intensity-duration-frequency (IDF)curves • Rainfall typically quantified as the depth of water that the given amount of rain could generate if distributed uniformly over the entire watershed • Intensity: average rate of precipitation (rainfall quantity/time, mm/h or in/h) • Duration: conventional meaning • Frequency: Frequency of storms with the specified duration and at least the specified intensity (yr-1); often quantified by its inverse – the recurrence interval or return period, Tr
Rainfall Patterns and Fates IDF curves show frequency of storms of at least the given intensity over the given duration.
Rainfall Patterns and Fates Model i vs D equations e.g., Guo (J. Hydrologic Eng.11, 506 [2006]) computed that the I-D relationship for 5-yr storms in Chicago over the past century could be described approximately by the following relationship, with a equal to 44.9 for the first half of the century and 61.0 for the second half (tD in min, i in inches/hr):
Rainfall Patterns and Fates Model i vs D equations WA State uses: Next slide: Table of a and n values for cities throughout WA from WA State Hydraulics Manual, p.2-15.
Hydrologic Risk • Hydrologic risk, J: likelihood of an event with recurrence interval Tr occurring at least once within a specified design period of N time units Tr and N are treated as dimensionless, but must be chosen such that they have the same units (usually, both in years), and Tr >1. For example, for both in years: 1/Tr= likelihood of failure in a given year;1-(1/Tr)= likelihood of not failing in a given year;[1-(1/Tr)]N = likelihood of not failing at all in N consecutive years;1 - [1-(1/Tr)]N = likelihood of failing at least once in N consecutive years;
Hydrologic Risk Example. A culvert on a highway is designed to just barely accommodate a “25-year storm.” What is the chance that it will never flood in its 30-year design life? Example. What design return period would have to be used to reduce the hydrologic risk to 10%?
Rainfall Hyetographs Hyetographs describe the varying rainfall intensity during a storm
Cumulative Rainfall Hyetographs Slope of this plot at any t is I(t) on previous slide; y(t) on this graph is integral from 0 to t of I(t) values on previous slide Note: On an IDF plot, this storm would be represented by a single point at I = (1.2 in)/(2.0 h) = 0.6 in/h, D = 2 h, and would fall on a curve that indicates how frequently storms of that intensity and duration occur. Lower plot normalizes values on x and y axes of upper plot, showing fraction of the precipitation that has occurred as a function of the fraction of the storm duration that has passed.
SCS 24-Hr Hyetograph Types Note: Rainfall pattern assumed to be independent of magnitude of storm
Rainfall Patterns • Example 2-2 in text demonstrates conversion of IDF data and SCS hyetograph types to hyetographs for particular return periods • Determine total precipitation for rainfall event of interest from IDF curves • Determine SCS hyetograph type for location of interest • For each time interval, determine incremental expected precipitation
Rainfall Patterns and Fates • Possible short-term fates of rainfall • Interception – capture of water before it hits the ground (on vegetation, buildings, etc.) • Depression storage – retention in low spots on land surface (note: capture by buildings sometimes put in this category rather than Interception) • Infiltration – into soil; might subsequently be taken up by plants, enter an aquifer, or re-appear at the surface as a spring or a feed into a stream • Runoff – our primary concern; also called effective or excess precipitation, Pe • Interception, depression storage, and infiltration collectively referred to as abstractions
Modeling Rainfall Fate • Interception • Vegetative interception significant only early in storm, since plants rapidly reach their holding capacity • Vegetative interception sometimes modeled as Lint =cPm, where P is total precipitation, and c and m depend on vegetation type (c typically 0.15-0.40, m typically 0.6-0.9) • Might be significant over longer times for buildings, depending on drainage system; typically estimated as 0.05-0.1 inch • Depression storage – • Usually much smaller than infiltration and, like interception, important primarily early in storm • Typical estimates of 0.2-0.4 inch for permeable areas; 0.05-0.1 inch for impermeable
Modeling Rainfall Fate • Infiltration • Several models have been proposed; consider just one here –the Horton equation (1940) t0 = time when runoff begins (often taken to be beginning of storm, but sometimes after a lag period) f0, ff = infiltration rates at t0 and at steady-state (at large t), respectively k = first-order rate constant, units of time-1
Modeling Rainfall Fate • Runoff • Several models have been proposed; most widely used is the SCS (Soil Conservation Service, now the Natural Resources Conservation Service) “curve number” model. • Model starts with a mass balance on precipitation: P = total precipitation for whole storm R = runoff (cumulative, for whole storm) Ia = initial abstraction; sum of all abstractions prior to the beginning of runoff F = retention; sum of all abstractions (primarily infiltration) since runoff began
Modeling Total Runoff: The SCS Model • Define SD as the soil moisture deficit when runoff begins (tR); i.e, the capacity for additional retention that remains when runoff begins • F/SDis the fraction of the soil moisture deficit at tR that is ultimately utilized • P - Iais the maximum runoff that can occur, if no abstractions occur from tR forward • Model assumption: The fraction of SD that is ultimately utilized is the same as the fraction of the potential maximum runoff that is realized: • Alternative statement of the assumption: the water distributes itself between infiltration and runoff in the same proportion as the ratio of the maximum possible infiltration to the maximum possible runoff at the time when runoff begins
Modeling Total Runoff: The SCS Model • Substituting the mass balance equation into the equation for the model assumption and carrying out some algebra yields: • Ia has been found to be approximately proportional to SD;Ia = 0.2 SD is a common assumption, in which case R depends only on SD:
Modeling Total Runoff: The SCS Model • SD assumed to be independent of storm parameters, but to depend on soil type, land use, and antecedent soil moisture condition (AMC) • Four soil groups (labeled A-D) and multiple land use categories defined • Each soil group/land use category assigned a curve number (CN) for intermediate AMC (designated AMC-II)
Modeling Total Runoff: The SCS Model • Curve numbers are adjusted for low (AMC-I) or high (AMC-III) moisture content, as follows: • Then, SD is computed from CN as: • Finally, R is computed as indicated previously:
Modeling Total Runoff: The SCS Model Example. A 71-ac urban watershed includes 60 ac of open area with 80% grass cover and 11 ac of industrial development that is 72% impervious. The soil is in SCS Group B. Estimate Pe and total runoff volume (ac-ft) for a 24-hr rainfall with Ptot= 1.5 in, for AMC-III conditions. 1. Find area-weighted, average CN for AMC-II (baseline) conditions.
Modeling Total Runoff: The SCS Model 2. Adjust CN for soil moisture conditions 3. Compute SD
Modeling Total Runoff: The SCS Model 4. Confirm that initial abstraction is less than precipitation, so that runoff occurs 5. Calculate Pe and total runoff
Modeling Total Runoff: The SCS Model Most storms: R is <60% of P
Design for Runoff Management • Design for conveyance of runoff away from watershed • Focus on peak runoff at the discharge (design) location, not cumulative amount of runoff during and after storm • Design based on protection against a storm of a pre-determined recurrence period • Peak discharge occurs once all parts of the watershed contribute flow to the design location • Design approach • Define time required before peak discharge is reached (i.e., longest time needed for water falling anywhere in the watershed to reach design location) as the time of concentration, tc • Choose design value for recurrence period • Relate peak flow to parameters describing storm and watershed characteristics (storm intensity and duration, time of concentration, watershed area, land cover, expected abstractions, etc.)
Time of Concentration: Example Watershed • Assume: • 2.5-hr storm • Runoff from each area starts at tavg and continues until tavg+2.5 hr • Define t = 0 as time when runoff begins (perhaps later than beginning of precipitation
Curve that would be obtained by shrinking areas to differential size Any lag time between pptn and runoff would be here Time of Concentration: Example Runoff Hydrograph Time Since Beginning of Runoff
Design For Runoff Conveyance • Estimating tc • Many empirical equations (see Table 2-8) • One common approach is to estimate flow velocity from average ground slope and land cover, and use travel distance to convert to time of flow from point expected to most remote (in time)
Design For Runoff Conveyance • Estimating Qmax using the Rational Method • Assume storm has uniform intensity, i, over watershed area and during full storm duration (justifiable only for relatively short storms over small areas [10’s of ac, or less]) • Assume runoff from unit area of watershed is directly proportional to rainfall intensity, so runoff rate at design point is: Q = runoff flow rate at the design point (volume/time) C = runoff coefficient (dimensionless) i= precipitation intensity (length/time) A = area contributing to runoff at the design point (initially zero, growing to total watershed area, Atot, at tc) (length2) Additional coefficient of 1.1-1.25 sometimes included for 25- to 100-yr storms, to account for reduced infiltration during intense storms Note: Although equation looks like a rainfall-runoff relationship, it is used only to estimate maximum runoff rate, as described next.
Design For Runoff Conveyance • Estimating Qmax using the Rational Method • According to the rational method assumption, runoff rate per unit of contributing area is proportional to storm intensity, i, which is steady • For storms with a given Tr, i decreases with increasing duration • For storms with steady i, Aactive and Q reach their maximum values at t = tc, and then remain at those values until the end of the storm • Therefore, since Q = CiA • For a given Tr, to maximize i, use shortest D • For a given i, to maximize Aactive, use D tc • To design for (approximate) maximum Q (i.e., maximum i *A), use shortest D that is tc; i.e., use D = tc • Note: if tc < 5 min, WA State Hydrology Manual specifies that tc = 5 min should be used.
Estimating Qmax Using the Rational Method Example. Estimate the peak runoff generated by a 10-yr storm occurring in a small residential development with the characteristics shown below. The development is in OR Hydrologic Zone 10 and has rolling terrain. Use the Henderson and Wooding eqn from Table 2-8 to estimate the time of concentration. Basin Area = 1.24 ac Length of overland flow = 164 ft Average land slope in basin = 0.02 Development density = 10 houses/ac Henderson & Wooding eqn, with tc in min, L in ft, i in in/hr:
Estimating Qmax Using the Rational Method From table, for urban residential areas (>6 houses/ac), n = 0.08; L and S are given, but i must be determined. • T&E approach: • Assume a value for i or tc • If tc was guessed, assume storm duration D = tc • Determine D or i from IDF curve (whichever was not assumed) • Compute tc from Henderson & Wooding • Repeat until D = tc
Estimating Qmax Using the Rational Method Guess tc= 5 min; For D = 5 min, i for 10-yr storm is 2.20 in/hr Guess tc= 10 min; For D = 10 min, i for 10-yr storm is 1.75 in/hr Guess tc= 12 min; For D = 12 min, i for 10-yr storm is 1.60 in/hr
Estimating Qmax Using the Rational Method From Table of runoff coefficients, C for dense residential area with rolling terrain is 0.75 (for Q in cfs, i in in/hr and A in ac). Using tc= D = 12 min, i = 1.60 in/hr:
Design For Runoff Conveyance • SCS method estimates tc in three categories • Shallow concentrated flow (e.g., in gullies) • Sheet flow over the land surface • Channel flow, in clearly-defined channels Shallow Concentrated Flow t = flow time (hr) n = Manning’s coef. for effective roughness for overland flow L = flow length (m or ft) P2 = 2-yr, 24-hr rainfall (cm or in) S = slope C = 0.029 (metric), 0.007 (US)
Design For Runoff Conveyance Sheet Flow and Channel Flow Both modeled using t = L/V, with V computed from Manning Eqn. For sheet flow, values of Rh and n assumed for two surface types: Paved: Rh = 0.2 ft, n = 0.025 Unpaved: Rh = 0.4 ft, n = 0.050 Yielding: with w = 16.1 ft/s (4.91 m/s) for paved and 20.3 ft/s (6.19 m/s) for unpaved
Design For Runoff Conveyance • Estimating Qmax using the SCS (NRCS) Method • Multi-step empirical equations leading to estimate of Qmax • Choose total precipitation, P (not Tr), for design storm • Determine CN for area and conditions of interest; use P and CN to estimate Ia / P from Table 2-10
Design For Runoff Conveyance • Estimating Qmax using the SCS (NRCS) Method • Multi-step empirical equations leading to estimate of Qmax • Use estimated Ia / P and SCS Storm Type (IA, I, II, or III) to estimate coefficients C0, C1, C2 from Table 2-9 • Insert coefficients and tc into equations on p.64 to estimate Qmax qu is “unit peak flow rate” in cfs per mi2 of watershed area per inch of precipitation (csm/in)
Design For Runoff Conveyance • Qmax from the SCS (NRCS) Method