Download
1 / 23
240 likes | 622 Vues
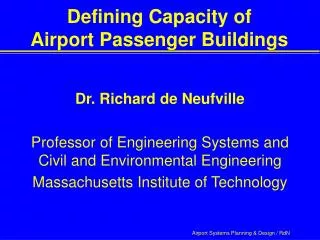
Design of Components of Airport Passenger Buildings. Dr. Richard de Neufville Professor of Engineering Systems and Civil and Environmental Engineering Massachusetts Institute of Technology. Design of Components of Airport Passenger Building.

E N D
Design of Components of Airport Passenger Buildings Dr. Richard de Neufville Professor of Engineering Systems and Civil and Environmental Engineering Massachusetts Institute of Technology Airport Systems Planning & Design / RdN
Design of Components of Airport Passenger Building • Objective: To show how standards for sizing can be integrated into design • Topics • 1. Procedure • 2. Practical Example :Paris/de Gaulle, Air France Passenger Building Airport Systems Planning & Design / RdN
Procedure • 1. Estimate Critical Loads ; Identify “hot spots” • 2. Calculate Requirements • Storage Areas • Lines • Hold Spaces • Flows • Corridors • Passageways • 3. Integrate into Design Airport Systems Planning & Design / RdN
Critical Loads (1) The essential problem is: CONCENTRATION OF TRAFFIC in time and space • People do not spread out evenly • People normally cluster in attractive places: • around check-in desks, gate areas • at mouth of baggage claim • at nearest of many facilities Airport Systems Planning & Design / RdN
Critical Loads (2) • Concentration phenomenon • Creates bottlenecks • These define capacity • Concentration phenomenon means: • Capacity of a large facility cannot be found simply by applying standards to whole area • Failure to grasp this fact often causes significant design failures Airport Systems Planning & Design / RdN
Example Hotspot Airport Systems Planning & Design / RdN
Estimation of Loads • Three important ideas: • 1. Cumulative Arrival Diagram • 2. Empirical Measurements necessary for each situation, site • 3 . Modulation by secondary activities Airport Systems Planning & Design / RdN
Calculation of Requirements • Recall from discussion of capacity: • Storage Facilities • queues, hold rooms, ... Require tradeoff: Cost vs. LOS • Flow Facilities • corridors, stairs, … Capacity much greater than most designers imagine Airport Systems Planning & Design / RdN
Calculating Storage Facilities I • Two Phases: • Exploration of Tradeoffs • Using cumulative arrival diagram • Sizing of Space Airport Systems Planning & Design / RdN
Calculating Storage Facilities II • Use of Cumulative Arrival Diagram • 1. Estimate, plot arrivals of Customers based on local measurements • 2. Superimpose departures of Customers generated by service rate of check-in, aerobridge, gate, ... • 3. Establish Maximum Customers Waiting as difference between arrivals and departures • 4. Explore Effect of Alternatives Airport Systems Planning & Design / RdN
Dwell Time Comparisons Airport Systems Planning & Design / RdN
Calculating Storage Facilities III • Two kinds of calculations: 1. Area = (Customers) (sq. m. per person) using appropriate space standards 2. Queue Length = (Customers) (0.6 m. per person) • Note: Queues generally project awkwardly • Often block passage for other customers Airport Systems Planning & Design / RdN
Typical Cumulative Load Diagram (Paris 1980) Airport Systems Planning & Design / RdN
Passengers Arrived Service Completed Speed of Service 1 Queue Length Passengers Served Typical Design Tradeoff for “Storage” Facilities Airport Systems Planning & Design / RdN
Typical Basis for Modulating Cumulative Load Diagram Airport Systems Planning & Design / RdN
Shift Typical Final Cumulative Load Diagram Airport Systems Planning & Design / RdN
Calculating Flow Facilities I • Note Carefully: • 1. Implication of Flow crucial • 2. Flow = > more apparent space • 3. Big difference between Storage and Flow capacity • Example of Difference • Storage Capacity • Space 3m wide, 30 m long ==> 90 sq.m area • Assume LOS = C ==> 1.9 sq. m per person • Storage capacity = 90 / 1.9 = 47 persons • Flow Capacity • Walking at 66m / minute • Apparent area = 3m (66 m/min) = 198 sq m / min • Flow Capacity = 198/1.9 = 94 persons / min = 5460 /hour!!! Airport Systems Planning & Design / RdN
Calculating Flow Facilities II • Procedure • 1. Choose LOS, Level of Service = > PMM, Persons per Meter width per Minute • 2. Calculate Effective Width Needed = Flow per minute / PMM • 3. Calculate Minimum Design Width = Effective Width + 1.5m. Extra is for edge effects due to walls, counter flows, ... Airport Systems Planning & Design / RdN
Example: Paris / de Gaulle Air France Building • Typical features before revision: • 1 hour flight turnaround at gate • 300 passengers per flight • 6 check-in counters per flight • 8 m. between counters and wall • 1.5 minute check-in time per passenger • 0.6 m. per passenger in line Airport Systems Planning & Design / RdN
Example Difficulties • Counters insufficient Passengers per minute = 300 / 50 = 6 Counters required = 6 (1.5 min) = 9 > 6 • Queue Space insufficient Assume half, 150 passengers wait Average queue = 150 / 6 = 25 ==> 25 (0.6 m.) = 15 > 8 m. Airport Systems Planning & Design / RdN
Example: Paris / de Gaulle Air France Building • Intercontinental (2A) after revision: • 1.30-2hr flight turnaround at gate • 300 passengers per flight • 6 check-in counters per flight • 12 m. between counters and wall • 2 minute check-in time per passenger • 0.6 m. per passenger in line • 4 Flights/gate per day Airport Systems Planning & Design / RdN
Example: Paris / de Gaulle Air France Building • European (2B) after revision: • 0.45-1 hour flight turnaround at gate • 100 passengers per flight • 3 check-in counters per flight • 12 m. between counters and wall • 1.5 minute check-in time per passenger • 0.6 m. per passenger in line • 8 Flights/gate per day Airport Systems Planning & Design / RdN
Revision of Air France Passenger Building Two main steps: • 1. To create queue space ==> eliminate obstructions (telephones, ...) ; add counters • 2. To guarantee service ==> Reduce Gate Use, using up to 2 hour turnaround • Capacity drops: 10-- 8 to ~ 6 flights/day • 50% more space needed to service load • Very Expensive problem!!! Airport Systems Planning & Design / RdN