Download
1 / 15
150 likes | 371 Vues
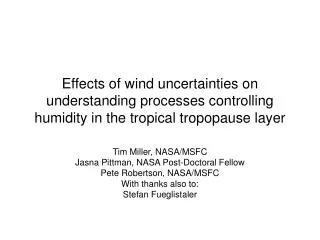
Effects of wind uncertainties on understanding processes controlling humidity in the tropical tropopause layer. Tim Miller, NASA/MSFC Jasna Pittman, NASA Post-Doctoral Fellow Pete Robertson, NASA/MSFC With thanks also to: Stefan Fueglistaler. Science and Mission Systems Office.

E N D
Effects of wind uncertainties on understanding processes controlling humidity in the tropical tropopause layer Tim Miller, NASA/MSFC Jasna Pittman, NASA Post-Doctoral Fellow Pete Robertson, NASA/MSFC With thanks also to: Stefan Fueglistaler
Science and Mission Systems Office Manager: C. Chitwood (Acting) Assist Mgr: J. Horack Deputy: T. May Exec Mgr: J. Sanchez Chief Engineer: S. Croomes Deputy Chief Engineer: G. Wentz VP10 VP02 New Projects & Partnerships Development Office Manager: F. Fogle Deputy: S. Cobb Business Management Office Manager: G. Hudson Deputy: B. Harper, CFO NSSTC Admin: Tina Swindell Nancy May Sandra Weber Direct VP20 Matrix NSSTC Executive Staff Manager: B. Anderson VP30 VP40 VP50 VP60 Exploration & Space Operations Manager: Vacant (T. VanHooser acting) Deputy: S. Swint RLEP-2 Project Office Manager: T. Lavoie Science Programs & Projects Office Manager: L. Johnson Deputy: K. Mitchell Science & Exploration Research Office Manager: J. Spann (acting) Deputy: Vacant CE: G. Wentz CE: S. Croomes CE: S. Turner CE: S. Croomes VP51 In-Space Transportation Office VP52 Space Systems Program/ Projects Office VP53 Discovery & New Frontiers Program Office VP31 Nuclear Office VP32 Exploration Propulsion Dev Office VP33 Exploration Systems Dev Office VP34 ISS Vehicle Office VP35 ISS Payloads Office VP61 Earth Science Office VP62 Space Science Office VP63 Optics Office
Water Vapor In The Tropics • Range from 3% at surface to 4 ppmv in tropical tropopause layer (TTL) and stratosphere (4 orders of magnitude) • Emissions (Tb) proportional to log(RH), so quantitative knowledge is essential, especially in the dry upper troposphere (mostly subtropics) • Outgoing IR at top of the atmosphere is very sensitive to the question: How dry is the upper troposphere in the subtropics? • Mechanisms determining concentrations of H2O transported from troposphere to stratosphere are still not well understood. • Water vapor is radiatively important in the TTL and lower stratosphere • Water vapor is the primary source of HOx, a key radical important in stratospheric ozone chemistry • Measurements in upper troposphere are sparse and not always dependable • Assimilation systems generally use radiosonde humidity data only up to 300 mb • Analyzed fields from major assimilation systems contain mostly model data above 300mb, and these may not compare well with satellite • Use of trajectories to study upper troposphere/TTL/stratosphere water vapor has become fairly common • But how good are the winds??
Tropical Tropopause Layer (TTL) Rather than having a tropopause acting virtually as a material surface (as can be thought of for the mid-latitudes), the tropics have a transition layer between the troposphere (where convection is active) and the stratosphere (where radiation is dominant). Illustration from Gettelman and Forster, JMSJ, 2002.
TTL Dehydration Process • Suggested by Holton & Gettelman (2001) and Hartmann et al. (2001) – both GRL; supported by several others including Fueglistaler et al., JGR 2005. • Air in upper TTL very slowly ascends, meanwhile traversing long horizontal distances • As it passes above strong convection (a “cold trap” region), it is adiabatically cooled due to lifting (resulting in cirrus), and while above the convection it radiatively cools to space, thus establishing a new (lower) minSMR as the condensed ice falls out. • Crucial to the theory is that net cooling to space occurs while the air is over (cold) cumulus • Previous studies have indicated that this mostly happens over the Western Pacific (and this is where H&G postulated)
Aircraft measurements in TTL, lower strat • Aircraft measurements by Pittman, Weinstock, et al. in eastern equatorial Pacific in Aug 2001 and Jan 2004 measured H2O, etc., from 360K – 440K (mid-TTL thru lower strat) • Indicate mostly sub-saturated TTL, suggesting that dehydration did not occur locally • It was decided that backward trajectory studies from the region of interest would tell us something about the processes determining the humidity levels, including where and when the dehydration likely occurred.
Backward Trajectory Calculations • Two sets of calculations were performed for the August 2001 case • Lagranto trajectory model, using ECMWF operational analyses (Fueglistaler) • HYSPLIT trajectory model, using ECMWF ERA-40 reanalysis on hybrid model levels (i.e. same vertical resolution as above) • Starting points were initialized every 0.5o for region 6oS – 10oN, 91oW – 77oW, and backwards trajectories calculated for 25 days. • Saturation mixing ratio (over ice) was calculated along the trajectories using analysis temperatures, and the minimum SMR along the trajectory recorded.
Winds at 70 mb, 100 mb 70 mb ~ 430K at equator 100 mb ~ 380K at equator
Locations of Min SMR Circles = ECMWF operational w/Lagranto Triangles = ERA-40 w/HYSPLIT
Height (theta) where minSMR occurred Points above black line are where minSMR occurred at a lower potential temperature than at the endpoint of the trajectory (i.e. indicating net ascent since the time of minSMR).
Conclusions • Results from the use of trajectories to study upper troposphere and TTL water vapor were not inconsistent with the cold trap theory of Holton et al., although with some bias. • Details such as location of cold trap were highly dependent upon wind data set and/or trajectory model. • Clearly, such studies are in need of consistent, dependable, and validated global wind analyses.