Download
1 / 15
150 likes | 240 Vues
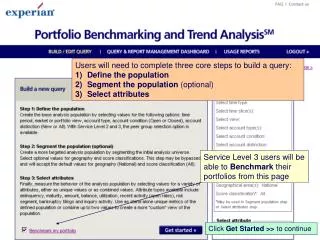
Users will need to complete three core steps to build a query: Define the population Segment the population (optional) Select attributes. Service Level 3 users will be able to Benchmark their portfolios from this page. Click Get Started >> to continue. Page One in Define the population

E N D
Users will need to complete three core steps to build a query: • Define the population • Segment the population (optional) • Select attributes Service Level 3 users will be able to Benchmark their portfolios from this page Click Get Started >> to continue
Page One in Define the population Select values for Time and View Select view: define how to aggregate the data1) Portfolio view: trades – de-duped2) Market view: consumers – all consumers* A Portfolio view will have impact to consumer type attributes later on Click Next >> to continue
Page Two in Define the population Select values for Account type, condition and distinction • Note that the Active query build (AQB) menu is now populated with previously made selections • Titles are hyperlinked for easy navigation
Page Two in Define the population Select values for Account type, condition and distinction Account distinction (new accounts): Narrow the base population to only those recently opened accounts, or use “New" as an attribute to measure open rates Click Next >> to continue
Page Three in Define the population – Service Level 2 and 3 users only: Select values for Peer groups Peer selections are driven off of Account Type Click Next >> to continue Click Skip Segmentation >> to accept default selections and go straight to attributes OR
Page One in Segment the population Select values for Geography Geographyselections include National, Regional, State or MSA Click Next >> to continue
Page Two in Segment the population Select values for Score Score: select Score classifications or create unique score groupings using Score bands Narrow the base population to only those accounts in a specific risk segment, or use “Score classification" as an attribute to create score distributions Click Next >> to continue
Final step: Select attributes Step 1: Attribute types available are determined by the View, Account type, Account condition, Account distinction and Score selections in the query build process Click Select attribute values >> to continue
Final step: Select attributes Step 2: Attribute values are determined by the type of attribute selected and in some instances,the account type for Loan Amount and Balance amount values Click Review query >> to continue
Review query • Name query • Save or Save & submit query Once all selections have been reviewed, name the query, which will also be the name of the associated report once it completes processing Click Save query >> to save it to the system for submission at another time OR Click Save & Submit >> to submit it for processing now
After submitting a query for processing, the user will be navigated to the Thank you page To view the query in the active dashboard, select the Query & Report Management Dashboard link
Use the page title links to navigate between activities Manage queries and reports from the Dashboard To view a query or a report, click into the title
Review output results: Print, download or graph The “Graph it” button will display only for those grids with < or = to 120 cells, determined by the Time and Geography selections made in the query
For Service Level 2 and 3 users, a list of Top 10 lenders is produced for each Account Type / Peer Group combination in the query Download>> or Print>> the results
Review graphed output results: • Percentage values will always be on the Y axis • Time values will always be on the X axis • Bars will identify the geography Download>> or Print>> the graph


![Designing the Conversation [SmashingConf 2016]](https://cdn4.slideserve.com/7568510/designing-the-conversation-dt.jpg)