Tennessee Valley Authority
230 likes | 429 Vues
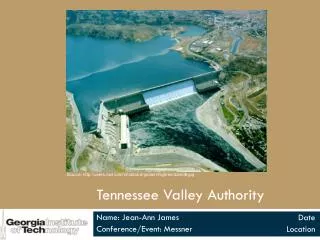
Tennessee Valley Authority. Source: http://users.owt.com/chubbard/gcdam/highres/dam08.jpg. Name: Jean-Ann James Conference/Event: Messner. Date Location. Overview. Purpose Location TVA timeline Power Generation Political Economic Impact Environmental Impact Social Impact

Tennessee Valley Authority
E N D
Presentation Transcript
Tennessee Valley Authority Source: http://users.owt.com/chubbard/gcdam/highres/dam08.jpg Name: Jean-Ann James Conference/Event: Messner Date Location
Overview • Purpose • Location • TVA timeline • Power Generation • Political • Economic Impact • Environmental Impact • Social Impact • Recent Developments
Purpose • Deal with problems affecting the Tennessee Valley • Flood control • Replant forests • Cheap electric power • Improve navigation along the Tennessee River • TVA Act was signed in 1933 by Franklin D Roosevelt
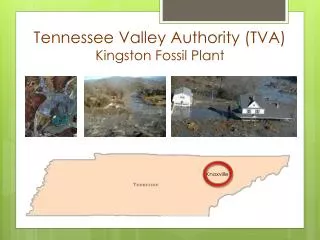
Location Source:tva.com
Time Line • 1930’s: • Developed fertilizers and taught farmers to improve crop yields. • Replanting of forests • Electricity generation from dams in the area • Electricity drew industries into the area • 1940’s • world war 2 & the need for aluminum, therefore energy • Largest hydropower construction project at the time • Employment 28000 • Electricity generation from dams in the area • 1950’s • 650 mile navigation channel that was the nations largest energy supplier • 1960’s • Began construction of nuclear power plants as more economic source of power
Power Generation Sources: hydro, fossil, nuclear & renewable 29 hydro electric dams; 11 coal fired (2 combined cycle, 8combustion-turbine);3 nuclear; 16 solar power sites; 1 wind power site; 2 diesel generator sites, 1 pumped-storage plant; 1 digester-gas site; 1 biomass co-firing. 15860 miles of transmission lines; 1070 interchange and customer connection points Serves 7 states: Tennessee, Georgia, Mississippi, Alabama, North Carolina, Kentucky, Virginia Generates more electricity than any other public utility in the US
Political Henry ford and Senator Norris argue about public ownership of the Wilson dam in Alabama 25 year struggle over TVA between republicans and democrats about financing and funding. TVA asked to issue it’s own bonds and use it’s operating budget to repay the US treasury $1 billion it had invested. Surrounding states and senators didn’t like the fact that if TVA no longer had financial restraints it would be able to sell cheaper power to their customers Bill allowing TVA to issue bonds (sales area limited to areas it served in 1957)
Economic Impact In 2008 attracted & retained 41k jobs $5.5 billion in capital investment In 2008 ~half a billion $ paid to state and local agencies in taxes Offers capital investment loans for new & growing businesses, small & minority business support $2.5 billion in tax equivalent payment 2001-2008 Barges on river carry 50 million tons of goods annually
Economic Impact 2 Self-supporting receives no government aid Sells TVA bonds & notes for finance to investors in 60 nations and all states Bonds backed by TVA power not the government Bonds receive highest credit ratings from major rating agencies 1999 bonds interest rate reset from 5.174% to 4.5% in May 2009 In 2008 $22.7 billion outstanding (statutory limit of $30 billion) Bonds are traded on the stock market as TVE and TVC
Economic Impact 3 Source: New York Stock Exchange (TVE)
Economic Impact 4 Source: New York Stock Exchange (TVE)
Environmental Impact 49 dams + reservoirs along 652 miles of Tennessee river Manages 293k acres of public land 34 Flood control dams $5.5 billion invested 1977-2010 to reduce air emissions from power plants Water from river system used to cool power plants
Environmental Impact 2 Source: http://www.tva.gov/environment/eii/eii_2007.htm
Environmental Impact 3 SO2 NOx CO2 Source: http://www.tva.gov/environment/air/index.htm
Environmental Impact 4 The amount of coal byproducts recycled Source: http://www.tva.gov/environment/air/index.htm
Environmental Impact 4 Clean Water Initiative Clean Marina Initiative Clean Boating campaign Tail water improvements (~$60 million) Reservoir ratings: Reservoir ecological health Stream ecological health Sport fishing ratings (based on the fish population)
Social Impact • In the 1930’s ~30% of the population affected by malaria • Development of Dams displaced 15000 families • Cheap electricity made life easier for farmers and more productive • Increase/ improvement in public infrastructure as more people moved into the area • Number of women in the workforce increased • Recognized unions for skilled and semi-skilled blue collar employees. • A class action lawsuit was filed against the agency claiming sexual discrimination
Recent Developments Coal ash spill in Roane county Tennessee (Dec 2008) Cleanup cost ~ $1.2 billion Devastated property values Property buyout $40.2 billion Stopped tourism + dislocation of retirees $43 million to be spent on economic development Ratchet Bonds (bond rates can be reset after years depending on market conditions).
Results of Recent Developments Renewed interest in the regulations for coal ash within the EPA and TVA EPA Survey of ash ponds and subsequently renovation of these ponds Classification of ash: hazardous/non-hazardous Identification of groundwater contamination Even with lower interest rates for ratchet bonds there has not been a decrease in the demand for the bonds
Results of Recent Developments 2 Source: Google images
References • TVA.gov • NYSE.com • Katz, David; (2009), The Power of the Callable Bond, CFO Research Services, http://www.cfo.com/article.cfm/13090515/1/c_13090433 • Farrell, Christopher; (2004), Bonds: 1994 All Over Again, http://www.businessweek.com/bwdaily/dnflash/apr2004/nf20040416_4402_db013.htm • Updegrave, Walter; (2004), To be or not to be in bonds, http://money.cnn.com/2004/11/09/pf/expert/ask_expert/index.htm • http://www.ourdocuments.gov/doc.php?flash=old&doc=65