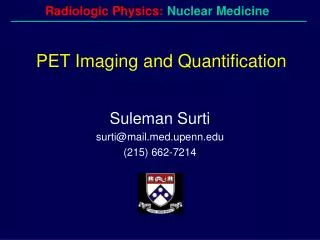
PET Imaging and Quantification
Radiologic Physics: Nuclear Medicine. PET Imaging and Quantification. Suleman Surti surti@mail.med.upenn.edu (215) 662-7214. vi) Two 511 keV photons produced by e + e - annihilation ~180˚. i) Unstable parent nucleus. iii) Positron travels short distance in tissue (Neutrino escapes).

PET Imaging and Quantification
E N D
Presentation Transcript
Radiologic Physics: Nuclear Medicine PET Imaging and Quantification Suleman Surti surti@mail.med.upenn.edu (215) 662-7214
vi) Two 511 keV photons produced by e+ e- annihilation ~180˚ i) Unstable parent nucleus iii) Positron travels short distance in tissue (Neutrino escapes) ii) Proton decays to neutron Emits positron and neutrino Positron decay 11C t1/2 = 20 minutes 13N t1/2 = 10 minutes 15O t1/2 = 2 minutes 18F t1/2 = 110 minutes
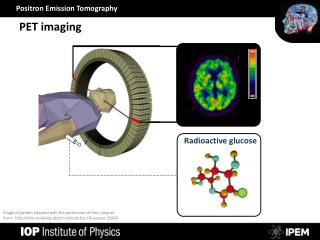
Positron Emission Tomography A primary goal and usefulness of a tomographic imaging modality such as PET is to achieve images where the intensity of each voxel in the image is proportional to the activity concentration present in the corresponding location in the patient
Scatter True Random True, Scatter, Random coincidences in PET • Trues ~ 2. A • A = Activity • = stopping power • Scatters ~ k . Trues • k ~ energy threshold • (depends on energy resolution) • Randoms ~ 2. (. A) 2 • 2 = coincidence timing window • (depends on decay time/light)
Count-rate Performance 70-cm long phantom (20-cm diameter) NEMA NU2-2001 Noise Equivalent Count-rate NEC = T/(1+S/T+R/T) Philips Gemini TF Univ. of Pennsylvania
R ~180˚ Limits on spatial resolution Positron range, R: • Photon non-collinearity: FWHMNC=0.0022 X scanner diameter (2-mm for a 90-cm diameter) Detector resolution (FWHMd )
PET Instrumentation Design • Scintillators stopping power, speed, light output • Detector configuration scintillator - photo-sensor coupling • Scanner geometry field-of-view (axial) • 2-dimensional vs. 3-dimensional • Time-of-flight PET • Data processing / image reconstruction scatter, randoms and attenuation correction • iterative reconstruction algorithms
Scintillation Detector Photo-Multiplier Tube (PMT) Scintillator
Small crystals require position encoding Block Detector CTI HR+ (1995) BGO 8 x 8 array 4 x 4 x 30 mm3 19 mm PMTs (4) 18,432 crystal elements (32 rings) 1,152 PMTs
Block vs. Quadrant Sharing Quadrant Sharing Block (W.-H. Wong) Standard Block (Casey-Nutt) Similar spatial resolution with larger PMTs or Better spatial resolution with similar size PMTs
Continuous optical coupling More uniform light output -> better energy resolution Similar spatial resolution with larger PMTs Example: Philips Allegro (2001) 17,864 crystal elements (GSO) 420 PMTs
High geometric sensitivity Low geometric sensitivity 2D 3D Low Scatter fraction ~ 10% High Scatter fraction ~ 30% Axial Slice Axial Slice 2D (septa) vs. 3D (no septa) 2D Imaging 3D Imaging
Scatter/True=k True Scatter/True>k Scatter Energy threshold reduces scatter & random coincidences- particularly in 3D
NEC Count-rates - 2D vs. 3D GE Advance 70-cm long phantom NEMA 2001 S.Kohlmeyer and T. Lewellen University of Washington 2D: 2001 3D: 2001 (380 keV) (300 keV) 0.14 Ci/cc
High count-rate capability in 3D PET requires fast, dense scintillator with good energy resolution LSO = 40 ns 0.81/cm BGO = 300 ns 0.91/cm Compare 3 CTI scanners: LSO Accel, BGO EXACT, BGO HR+ (2D) 3D Accel 2D HR+ NEC (cps) • Both measurements assume randoms smoothing • Courtesy of CTI, inc 3D EXACT
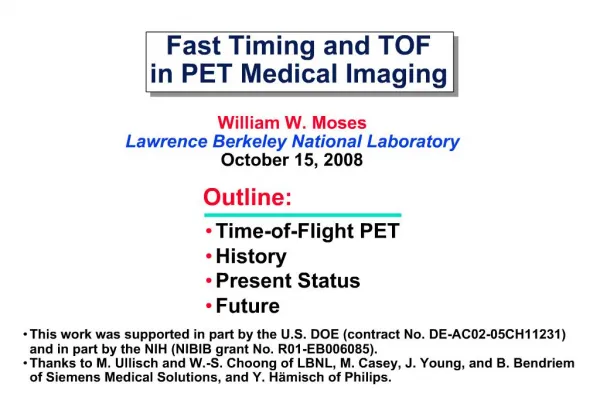
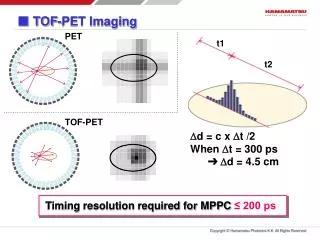
x t1 t2 D Time-of-flight PET • Can localize source along line of flight - depends on timing resolution of detectors • Time of flight information reduces noise in images - weighted back-projection along LOR t = uncertainty in measurement of t1-t2 x= uncertainty in position along LOR = c .t/2 D/x~ reduction in variance or gain in sensitivity
Does Noise-Equivalent Count-rate (NEC) infer Image Quality? NEC = Trues / (1 + Scatter/Trues + Randoms/Trues) NEC1/2 ~ Signal / Noise • NEC includes global effects • Trues • Noise from scatter and randoms • NEC does not include local effects • Spatial resolution - variations within FOV • Image reconstruction • Accuracy of scatter and randoms correction • Attenuation correction • Deadtime corrections and normalization
Fully 3D Iterative Reconstruction improves image quality Philips Allegro Filtered Backprojection 3D Ramla
Positron Emission Tomography What is needed to achieve quantitative PET images? Deadtime correction Data Normalization Scatter correction Randoms correction Attenuation correction
Deadtime correction • Deadtime — High count-rate effect present in radiation detectors • Two manifestations: • Pulse pileup — Events are collected but measurements such as energy and spatial position are affected (reduced image quality) • Loss of counts — Due to electronics deadtime and determined mainly by scintillator decay time • Loss of counts corrected by measuring collected counts vs activity in a uniform cylinder
> d d Data normalization • Normalization — non-uniformities in event detection over the full scanner • Two sources: • Variation in amount of scintillation light collection due to crystal non-uniformities and detector design (detector effect) • Difference in detection sensitivity due to angle of incidence
Rotating rod source Uniform cylinder Data normalization techniques
non TOF CT A B TOF Scatter Correction (SSS) • Contribution to LOR AB • from each scatter point — • Activity distribution and • Klein-Nishina equation • Repeat for all LORs to get • scatter sinogram P188
Signal A time A Delayed Signal A Coincidence Window, B Signal B Randoms Correction — Delayed window technique
Why do we need attenuation correction? • More accurate activity distribution uniform liver, ‘cold lungs’ • Improved lesion detectability deep lesions • Reduce image artifacts and streaking reconstruct using consistent data • Improved image quality with iterative reconstructioninclude attenuation into model But…attenuation correction must be FAST - compared to emission scan ACCURATE - e.g. near lung boundary LOW NOISE - minimize noise propagation
Attenuation correction can be calculated directly in PET patient Total path length, D=d1+d2 D can be independently measured and allows an accurate correction PET: High energy photons with small , but pair of photons must traverse entire body width. d1 d2 I/I0 = e -d1 e-d2 = e-(d1+d2) (511kev) = 0.095/cm I/I0= e-d1 e-d2 = 0.06 for D=30cm
PET transmission source (68Ge/68Ga) - source of coincident annihilation photons (mono energetic @ 511 keV), 265 day half life Single photon source (137Cs) - source of single -rays (mono energetic @ 662 keV), 20 yr half-life X-ray CT scan - source of X-rays with a distribution of energies from ~30 to 120 keV. We can assume an ‘effective’ energy of ~ 75 keV -ray source spectra X-ray source positron source Intensity I0(E) 0 E (keV) 30 120 511 662 Transmission sources for attenuation measurements (Recall that the PET emission data is attenuated at 511 keV)
Transmission Scan 137Cs point source 662 keV, t1/2 = 30 yr d2 d1 d1 + d2 = D Emission I / I0 = e-d1 . e-d2 = e-D Transmission I / I0 = e-D
Post-injection transmission scan Philips Allegro • 20 mCi 137Cs pt src • 40 sec Tx acquisition • Energy scaling • EC subtraction • Segmentation • Interleaved Em-Tx • 7 Em frames 9 Tx frames University of Pennsylvania PET Center
CT-based attenuation correction: threshold method STEP 1: Separate bone and soft tissue using threshold of 300 H.U. STEP 2: Scale to PET energy 511 keV. Scale factors (511:~70 keV): bone 0.41, soft tissue: 0.50 STEP 3: Forward project to obtain attenuation correction factors. Kinahan PE, Townsend DW, Beyer T, et al. Med Phys. 1998; 25(10): 2046-2053.
Potential problems for CT-based attenuation correction • Difference in CT and PET respiratory patterns Can lead to artifacts near the dome of the liver • Use of contrast agent Can cause incorrect values in PET image • Truncation of CT image due to keeping arms down in the field of view to match the PET scan Can cause artifacts in corresponding regions in PET image • Bias in the CT image due to beam-hardening and scatter from the arms in the field of view
Attenuation correction for PET Types of transmission images Single photon Cs-137 (662 keV) lower noise 5-10 min scan time some bias lower contrast X-ray (~30-130 keV) no noise 1 min scan time potential for bias high contrast Coincident photon Ge-68/Ga-68 (511 keV) high noise 15-30 min scan time low bias low contrast Alessio AM, Kinahan PE, Cheng PM, et al. Radiol. Clin. N. America 2004; 42(6): 1017-1032.
Attenuation correction - increased confidence of liver lesion No AC AC Philips Allegro University of Pennsylvania PET Center
Attenuation correction - better comparison of relative activity of deep (mediastinum) vs. superficial (axilla) lesions No AC AC Philips Allegro University of Pennsylvania PET Center
Image quality degrades with heavy patients Slim 58 kg“Normal” 89 kgHeavy 127 kg Increasing attenuation(less counts) Increasing scatter(more noise) Increasing volume(lower count density)
How can we improve image quality? 2D - counts limited by septa and maximum allowed dose 3D - counts limited by dead-time and randoms Scintillator High stopping power - higher coincidence fraction Fast decay - lower dead-time and randoms Energy resolution - lower scatter and randoms Geometry Sensitivity ~ (Axial FOV)2 (increased scintillator and PMT cost) Time-of-flight Requires very fast scintillator with excellent timing resolution
x t1 t2 D Time-of-flight PET • Can localize source along line of flight - depends on timing resolution of detectors • Time of flight information reduces noise in images - weighted back-projection along LOR t = uncertainty in measurement of t1-t2 x= uncertainty in position along LOR = c .t/2 D/x~ reduction in variance or gain in sensitivity
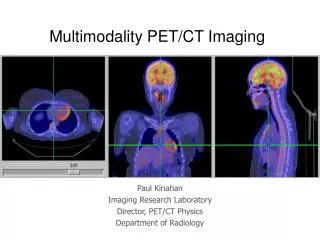
Time-of-flight PET PET scanner 70-cm bore 18-cm axial FOV CT scanner Brilliance 16-slice Philips Gemini TF Univ. of Pennsylvania PET shows increased FDG uptake in region of porta hepatis CT demonstrates that this uptake corresponds to the gallbladder representing acute cholecystitis, not bowel activity
non TOF TOF non TOF TOF 3 min 5 min 1 min 3 min 4-to-1 contrast; IEC phantom 6-to-1 contrast; 35-cm diameter 2.2 mCi in IEC, 5.4 mCi in line source cylinder 7.0 mCi in all phantoms Phantom measurements
Gemini TF Improvement in lesion detectability with TOF Heavy-weight patient study 13 mCi 2 hr post-inj 3 min/bed Colon cancer 119 kg BMI = 46.5 MIP LDCT non-TOF TOF
Clinical 18F-FDG imaging • Clinical 18F-FDG imaging essentially involves two tasks: • Identifying regions with abnormal uptake (lesion detection) • Deriving a measure of glucose metabolism in these regions (lesion estimation task)
Factors affecting lesion detection and activity estimation • Accuracy of scanner normalization and corrections for deadtime, scatter, randoms, & attenuation • Remove biases with minimal noise propagation • Spatial resolution • Lesion size and partial volume effects • Lesion activity uptake relative to background • Scan time • Reduced noise • Patient habitus • Determines amount of Sc, R, and attenuation • Reconstruction • Determines amount of noise in image and for iterative algorithms plays off contrast recovery with noise
PET scanner design is still an evolving area of research with new scintillators and photo-detectors being developed Current generation of clinical scanners achieve spatial resolution of 4-5 mm Fully-3D imaging is imaging mode of choice PET is still count limited TOF PET can help improve the statistical quality of PET images PET/CT as a multi-modality imaging device has increased the confidence in interpreting PET images Future direction - PET/MRI scanners Summary
18F-Fluoro-Deoxy-Glucose (FDG) OH Ido et al. 1978 O H Glucose Blood -> tissue -> cell phosphorylation - glycogen OH OH OH FDG Blood -> tissue phosphorylation 18F Patient injected activity:10 mCi = 3.7 x 10⁸ dps Tracer kinetics:6 pico-mole ~ 1 nano-gram
2 min 3 min 4 min 5 min Lesion detectability Non-TOF TOF • Improved lesion detectability with TOF achieved with short scan time • and reduced reconstruction time (# of iterations) • Spheres are just barely visible with a 5 minute scan in non-TOF • After a 2-3 minute scan in TOF the spheres become visible 6-to-1 contrast; 35-cm diam. cyl.; 10-mm diam. spheres 6.4mCi in all phantoms
Time-of-flight scanners need investigation of new data processing and image reconstruction methods • Scatter correction - can incorporate timing information - energy based methods - statistical weighting • Image reconstruction - list-mode ML-EM - optimize use of TOF - include data corrections in system model - spatial recovery • Data quantification - SUV estimation - convergence of lesion contrast improves with TOF • Image evaluation - lesion detectability measures - how does TOF improve SNR in image?