Quantification
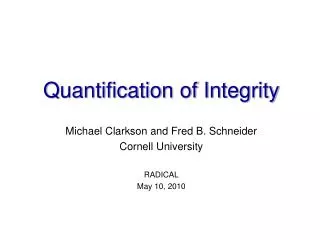
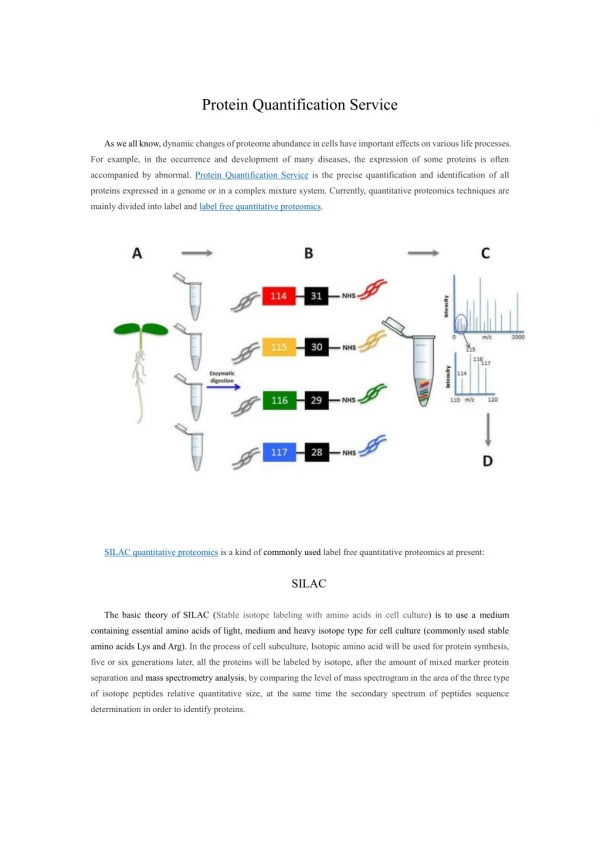
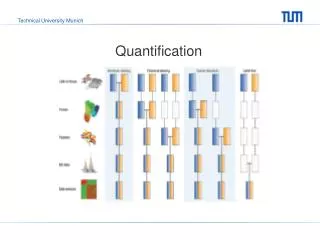
Quantification. Setup. ?. ?. Myc-Protein. Flag-Protein. ?. ?. ‘Heavy’. ‘Light’. Arg (6)Lys(4). Immunoprecipitation with FLAG antibody. Specific “Bait” . Specific “Interactor” . Non-specific. 000431_B06_P003075_B07_A00_R1. #. 4734. RT:. 38.00. AV:. 1. NL:. 1.99E6. T:.

Quantification
E N D
Presentation Transcript
Setup ? ? Myc-Protein Flag-Protein ? ? ‘Heavy’ ‘Light’ Arg(6)Lys(4) Immunoprecipitation with FLAG antibody Specific “Bait” Specific “Interactor” Non-specific
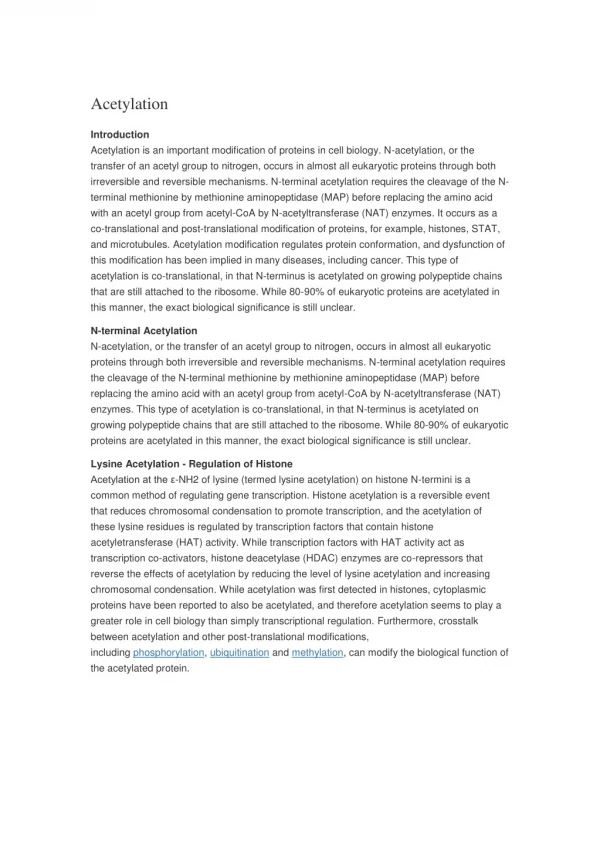
000431_B06_P003075_B07_A00_R1 # 4734 RT: 38.00 AV: 1 NL: 1.99E6 T: FTMS + p NSI Full ms [300.00-2000.00] 483.22 100 95 90 85 80 75 70 65 60 55 Relative Abundance 50 483.72 45 40 35 30 25 20 484.22 15 10 484.28 486.23 483.08 5 484.72 482.72 483.28 485.23 486.73 487.86 484.07 0 482.5 483.0 483.5 484.0 484.5 485.0 485.5 486.0 486.5 487.0 487.5 488.0 m/z Example: Quantification of the Bait protein Bait protein peptide: Scan number 4602, zoom in at m/z 483 Sequence is :VDVCTTDR As the peptide is doubly charged and contains one heavy R (6) The heavy labeled peptide should be vissible at +3 m/z Light peptide
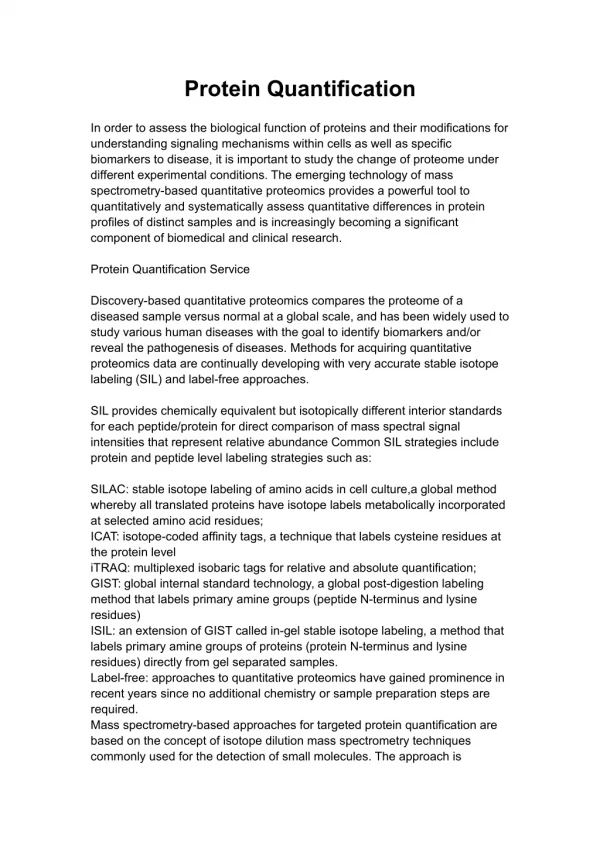
Ratio The ratio can be calculated from: Comparing intensities in the MS1 scan i.e. summing up all isotope intensities for both heavy and light peptide and dividing H/L 483.22 100 95 90 85 80 75 70 65 60 55 Relative Abundance 50 483.72 45 40 35 30 25 20 484.22 15 10 484.28 486.23 483.08 5 484.72 482.72 483.28 485.23 486.73 487.86 484.07 0 482.5 483.0 483.5 484.0 484.5 485.0 485.5 486.0 486.5 487.0 487.5 488.0 m/z
Ratio The ratio can be calculated from: 2. Making extracted ion chromatograms (XIC) of the peptides and calculating the area under the curve and taking the ratio of those areas. This is the safer methods as intensities might change over the elution time and peptides might not co-elute
Name: Matrikelnumber: Exercise 1 In the quantification raw file go to scan number 8874 Zoom into the peak at m/z 428 This is a light labeled peptide. The Heavy labeled peptide contains on Lys(4) Determine the charge state of the peptide Look for the Heavy labeled peptide Measure the intensity of all the isotopes for both light and heavy peptide Calculate the ratio
Name: Matrikelnumber: Exercise 2 In the quantification raw file go to scan number 12996 Zoom into the peak at m/z 818 This is a light labeled peptide. The Heavy labeled peptide contains on Arg(6) Determine the charge state of the peptide Look for the Heavy labeled peptide Make an extracted ion chromatogram of the two peaks Overlay and calculate the peak area Calculate the ratio
Automated quantification • MaxQuant performs automatic quantification and identification of proteins by finding the ratios between light and heavy labeled peptides. Protein ratio’s are then derived from the median of the peptide ratio’s. • Perseus is a software that has statistical tools that allow you to look at the data
Perseus • Load the file: AffinityPurification_SILAC.txt into Perseus • Log2 transform the Intensity and Ratio columns • Make a scatterplot • Should the data be normalized??? Which proteins are changing significantly Processing Significance B (use for truncation P-value)