Download
1 / 36
360 likes | 454 Vues
This study discusses attenuation in dietary studies, introduces a new model using self-report and biomarkers, and highlights the importance of accurate estimation. It explores how attenuation affects relative risk and sample sizes in studies and emphasizes the crucial role of estimating attenuation for precise results.

E N D
A New Model for Dietary Intake Instruments Based on Self-Report and Biomarkers Raymond J. Carroll Texas A&M University(http://stat.tamu.edu/~carroll) Victor Kipnis, Doug Midthune National Cancer Institute Laurence Freedman Bar-Ilan University
Outline • Attenuation& its impact (Review) • Reference instruments (Review) • Protein intake: contradictory resultsfrom various studies • Assumptions: reference instruments • Urinary Nitrogen (UN) as a biomarker • New model that “explains” the contradictory results • Discussion & conclusions
Attenuation of the FFQ • Usually denoted by • Defined as the slope in a linear regression of usual intake on the FFQ • Typically 0 < <1 • Relative risk (RR) is attenuated • Observed RR is from FFQ • True RR is from usual intake • Observed RR = (True RR)l • True RR = (Observed RR)1/l
Why Attenuation Matters (I) • True RR = (Observed RR)1/l • Suppose Observed RR = 1.10 • If = 0.3, then true relative risk is 1.101/0.3 = 1.37 • If = 0.1, then true relative risk is 1.101/0.1 = 2.59 • If you think that = 0.3, but really = 0.1, then you grossly underestimate true relative risk
Why Attenuation Matters (II) • Sample sizes for studies to achieve a given power are proportional to 1/2 • Thus, if you think the attenuation is estimate, and the real attenuation istrue, then your study is too small by the factor (estimate / true)2 • Thus, if you thinkestimate = 0.3, but in facttrue = 0.1, then your study is too small by a factor of 9. • Estimating attenuation is crucial!
Estimating Attenuation • = the slope in a linear regression of usual intake on the FFQ • We do not observe usual intake! • Leads to the idea of a reference instrument • 24 hour recalls • Diaries • Weighed food records • Biomarkers • The general idea is to use the reference instrument to estimate the attenuation
Estimating Attenuation • = the slope in a linear regression of usual intake on the FFQ • The trick: replace usual intake by the reference instrument • Thus, estimate is the slope in a linear regression of the reference instrument on the FFQ • Easily computed in a pilot study • As it turns out, not all reference instruments are created equal • In designing a study, the choice of reference instrument is crucial
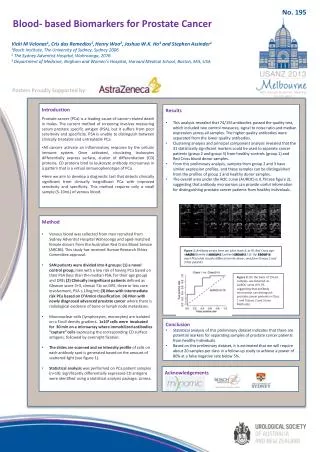
Results from Various Studies • We have data from 7 cohorts • 5 EPIC cohorts (24-hour recalls) • Cambridge pilot study (weighed food records) • Norfolk study (diaries) • These reference instruments are based on self-report • All 7 have a biomarker for protein intake: urinary nitrogen (UN) • We can thus contrast the attenuations of the reference instruments and the biomarker
Attenuation CoefficientsBiomarker and StandardBiomarker average = 0.21Reference average = 0.33
An Illustration • Norfolk (UK) study with diaries as reference instrument • True RR = (Observed RR)1/l • Suppose Observed RR = 1.10 • (diary) = 0.249 • True RR =1.47 • (UN) = 0.085 • True RR =3.07 • Difference in the epidemiological implications of the two numbers is enormous
Design Issues • Sample sizes for studies to achieve a given power are proportional to 1/2 • Thus, if you think the attenuation is estimate, and the real attenuation istrue, then your study is too small by the factor (estimate / true)2 • Thus, if you thinkestimate = 0.249, but in facttrue = 0.085, then your study is too small by a factor of 8.6. • Estimating attenuation is crucial!
Sample Size Inflation FactorBiomarker versus Standard7 studies with Protein Biomarker
Reference Instrument Assumptions • =the slope in a linear regression of usual intake on the FFQ • estimateis the slope in a linear regression of the reference instrument on the FFQ • Necessary assumptions on the reference instrument • Unbiased for usual intake: E(Reference|usual) = Usual • “Error” in reference instrument uncorrelated with the FFQ • We claim both assumptions are violated for standard self-report reference instruments
Model for the FFQ • Flattened Slope: those with high intakes tend to underreport • Pure or measurement error: different answers when taking the instrument multiple times • Person-specific bias (new): 2 people with exactly the same usual intake will recall things differently, even if the FFQ is given many, many times • The person-specific bias is a random effect unique to the individual, but vital to analysis
Model for the FFQ • Flattened Slope • Measurement error • Person-specific bias • Let T(i) be usual intake • Our model is FFQ(ij) = + T(i) + r(i) + (ij) • Note the color coordination! • Generally, < 1, hence the slope is flattened • In our experience, the person-specific bias contributes quite a lot of the overall random error
Model for the FFQ • Flattened Slope • Measurement error • Person-specific bias FFQ(ij) = + T(i) + r(i) + (ij) • It makes sense that any self-report instrument has the same features Diary(ij) = + T(i) + s(i) + (ij) • It also makes sense to believe that the person-specific biases are correlated (r,s) = correlation{r(i),s(i)} • This correlation is critical!
Urinary Nitrogen as a Protein Biomarker • We have undertaken a meta-analysis of five small feeding studies that measured log(protein intake) and log(UN) • Let i = person, j = replicate, M(ij)= UN • No flattened slope! • Tiny person-specific bias, can be ignored FFQ(ij) = + T(i) + r(i) + (ij) Diary(ij) = + T(i) + s(i) + (ij) Biomarker(ij) = T(i) + (ij)
The Model Summarized • Flattened Slope • Measurement error • Person-specific bias FFQ(ij) = + T(i) + r(i) + (ij) Diary(ij) = + T(i) + s(i) + (ij) Biomarker(ij) = T(i) + (ij) (r,s) = correlation{r(i),s(i)} If 1or(r,s) 0, then the Diary does not yield a correct estimate of attenuation (unbiased with error uncorrelated with the FFQ)
Analysis of the Norfolk Study FFQ(ij) = + T(i) + r(i) + (ij) Diary(ij) = + T(i) + s(i) + (ij) Biomarker(ij) = T(i) + (ij) (r,s) = correlation{r(i),s(i)} • We fit this model using maximum likelihood • = 0.639 • (r,s) = 0.573 (NOTE!) • Attenuation(Diary, from model) = .251 • Attenuation(Biomarker, from model) = .069
Does the Model Fit the Data? • The model seems plausible • It gives results for attenuation that are consistent with using the protein biomarker as a reference instrument • It gives a partial explanation (correlated person-specific biases) for the wide discrepancy in estimated attenuations for different reference instruments • It can be tested with the Norfolk and MRC data
Models Compared • Compare published models • Saturated • Plummer-Clayton • Rosner, et al • No flattened slope for diary • No person-specific bias for diary • Errors in FFQ and diary uncorrelated • Kaaks, et al • No flattened slope for diary • Person-specific biases uncorrelated
Models Compared • Freedman, Carroll & Wax • No flattened slope for diary • No person-specific bias for diary • Errors in diary and FFQ can be correlated if done at same time • Kipnis, Freedman & Carroll • No flattened slope for diary • Errors in diary and FFQ can be correlated if done at same time
Models Compared • Spiegelman, et al • No flattened slope for diary • No person specific biases incorporated explicitly • Person-specific bias and measurement error combined into total error at an exam time • Total error in FFQ and total error in Diary have common correlation across repeated exam times, e.g., FFQ at first exam and Diary at second exam • Seems implausible given our experience
Models Compared • We compared the models on the basis of AIC • 2(loglikelihood) - 2(#parameters) • The loglikelihood increases as models become more complex • The blue term penalizes more complex models, so that the loglikelihood has to increase in such a way as to overcome increased complexity of the model
Body Mass • The model up to now has not included body mass • There is concern that the results might be affected by this omission • One can add body mass into the model, by adding a linear term, e.g., (noting the last line) • FFQ(ij) = + T(i) + 1 B(i) + r(i) + (ij) • Diary(ij) = + T(i)+ 2 B(i) + s(i) + (ij) • Marker(ij) = T(i) + (ij)
Body Mass • FFQ(ij) = + T(i) + 1 B(i) + r(i) + (ij) • Diary(ij) = + T(i)+ 2 B(i) + s(i) + (ij) • Marker(ij) = T(i) + (ij) • This model indicates that the means depend on body mass, but the variances do not • We refit all the models, and still ours had highest AIC • Attenuations were hardly changed at all: little impact of BMI
Body Mass • Prentice constructed a model that had attenuation depending on body mass. His model was a special case of ours, but applied to BMI tertiles • We refit his analysis to the EPIC, Cambridge and Norfolk cohorts, computing attenuation in each body mass tertile • Prentice suggested that attenuation became more severe as BMI increased • We see no such effect
Weighted Average Attenuation and BMI: Protein BiomarkerResults of 11 cohorts (men+women)
Summary of Results • Attenuation is the key parameter • It controls how badly relative risks are affected by imprecision in instruments • It controls the sample size necessary to achieve a given statistical power • Designing experiments and instruments in order to estimate the attenuation is therefore crucial
Summary • It is common to use a reference instrument based on self report to estimate the attenuation • 24-hour recalls • Diaries • Weighed food records • For protein intake, where the UN biomarker is available, these self-report reference instruments clearly underestimate the magnitude of the problem of error and biases in FFQ’s
Summary • We constructed a new model that may explain why it is that self-report reference instruments do so poorly • The models have these features • flattened slopes • measurement errors • person-specific biases • correlation in the person-specific biases • The newest feature of this model is in allowing the person-specific biases to be correlated
Summary • We compared the new model to other models proposed in the literature, using the Norfolk and MRC data sets • Our model was NOT statistically significantly different from any other more complex model • Our model WAS statistically significantly better than any submodel • Our model had highest AIC in both data sets
Summary • We also briefly discussed whether body mass plays an important role in these findings • We added BMI to our models, with no change • There is no indication that attenuation depends on body mass, even when we did separate analyses by BMI tertile
Summary • It is worth remembering that in the Norfolk study, the estimated attenuations were • diary: 0.247 • biomarker: 0.085 • The relative risks were affected. If observed RR is 1.10, true would be • diary: 1.47 • biomarker: 3.07 • Designing a study with the diary to estimate attenuation results in an underestimation of sample size by a factor of 8.6
Future Studies • Most analyses include energy intake in a relative risk model • No data are available yet which have both a nutrient biomarker (protein) and an energy biomarker • The NCI-OPEN study will have such data (reference instrument = 24-hour recall) • Our models are easily generalized to the multivariate case • We will see then whether adjusting for energy affects the attenuation of protein intake