Download
1 / 39
390 likes | 414 Vues
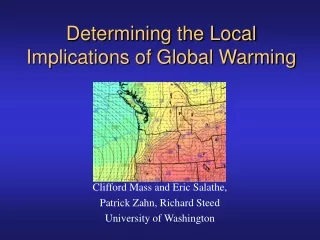
This presentation delves into the effects of global warming on the Pacific Northwest, focusing on the impact on snowpack levels and climate patterns. It explores the scientific consensus, recent research findings, and the delayed warming effects in the region. Key points include the complexity of climate change, local variations in impact, and the use of advanced modeling to predict future outcomes. Through an analysis of historical data and current trends, the presentation highlights the need for continued research to understand the evolving climate dynamics in the Pacific Northwest.

E N D
Global Warming and Its Implications for the Pacific Northwest Cliff Mass University of Washington Presented at the WPC Climate Conference, July 15, 2008
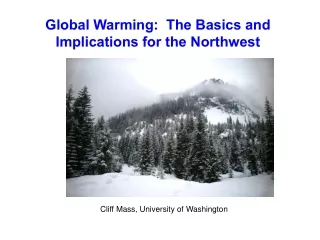
Three Key Points • Global warming forced by increased greenhouse gases isinevitable and will be highly significant in its effects on mankind. • The science is well understood and based on fundamental physics and sophisticated models. • Uncertainties exists, but will not change the essential results.
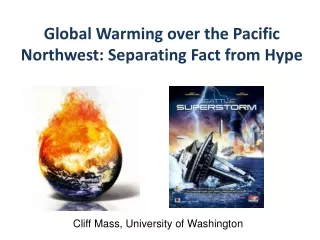
Three Key Points • Outside of the Arctic, the global warming signal during the past several decades has generally been subtle and masked by the normal variability of the climate system. • In some cases, global warming “supporters’ have hyped its current andpast effects (e.g., Katrina, Cascade snowpack reduction) • In other cases, global warming “skeptics” have wrongly dismissed global warming’s future influence based on incorrect interpretations of the past and current climate record (this spring’s cold spell) or brought up “red herring” factors (solar variability).
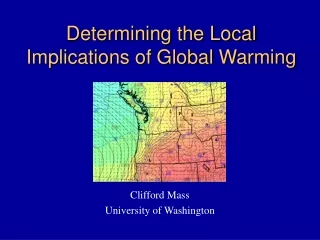
Three Key Points • Remember the global in global warming. • Although the globe as a whole will warm, the changes will NOT be uniform. • Some areas (e.g., the polar regions) will experience huge changes while in others the effects will be far less. • The Pacific Northwest may well be one of those regions of delayed or lesser effects. • The variability in local impact of GW is a key research topic today… and an issue of great societal importance.
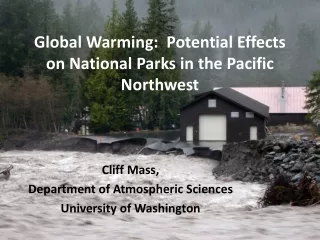
Have Large Impacts of Global Warming Already Occurred in the Pacific Northwest? Some claims: • 30-50% loss of Cascade snowpack • Maximum streamflow occurring 20-30 days earlier • Heavier rain and more floods. The truth is that there is no evidence that human induced global warming has caused such significant impacts. But that is not saying that they won’t occur in the future.
Loss of Northwest SnowpackDue to Global Warming • Some local scientists and politicians have claimed a loss up to 50% since 1950 and have either implied, suggested, or explicitly stated that this is due to global warming. • Is this really true?
Scientific Consensus Statement Signed by Several Dozen Prominent NW Scientists for the Governor of Oregon
From Mote et al 2006
Washington-wide snowpack since 1950, Relative to 1971-2000 normal Snowpack in usual maximum month
Washington-wide snowpack period of record, Relative to 1971-2000 normal Snowpack in usual maximum month
New Research: Stoelinga, Mass, and Albright 2008 Proxy Oregon/Washington Snowpack (April 1 Snow Water Equ) Trends Depend on When You Start
Cascade Snowpack has INCREASED during the past 30 years 1976-2007 Trends in 1 Apr SWE for Elevation Quartiles (EQs): EQ4: +7.1% EQ3: +9.4% EQ2: +7.8% EQ1: +6.4% EQ4 High EQ3 EQ2 EQ1 Low Stoelinga et al 2008. Time series of elevation quartile (EQ)-averaged 1 April SWE (in mm) measured at snow course during the period 1976-2007. Elevation ranges for the four quartiles are: (1) 792-1119 m; (2) 1119-1288 m; (3) 1288-1542 m; and (4) 1542-1981 m. Dashed lines show best-fit lines for each EQ. Also listed are the 1976-2007 trends for each EQ (as percent of the 1961-1990 mean).
Pacific Decadal Oscillation (PDO) PDO is thought to be a natural mode of atmospheric variability Negative phase of PDO associated with greater snowpack in NW.
Why has the Northwest snowpack remained the same or increased during the last several decades while global observations suggest we are in the midst of a 30 year warm-up period, one that models suggest is due to greenhouse gas emission?
IPCC Report
Observations has shown that the eastern Pacific has not warmed up much during the last thirty years.
-1.4 -1.2 -1.0 -0.8 -0.6 -0.4 -0.2 0.0 +0.2 +0.4 +0.6 +0.8 +1.0 +1.2 +1.4 Air Temperature Trend (1979-2005) Change in Surface Air Temperature (°C) from 1979-2008
General Circulation Model Simulations for the Next Century Also Suggest that the Eastern Pacific Will Warm Up Less Than Most of the Globe
Averaging a collection of the best GCMs over the Pacific Suggests the Same Thing for the Future (a) SST (b) Tsfc (c) T850 SST 850 mb 0.0 +0.2 +0.4 +0.6 +0.8 +1.0 +2.0 +3.0 °C Air Temp Stoelinga, Albright and Mass 2008 Predicted linear trend of November-March mean temperature for 2000 to 2025 (°C), as predicted by the ensemble of climate models used in the IPCC AR4 report. Shown are the ensemble means of (a) sea-surface temperature, (b) surface air temperature, and (c) 850-hPa temperature.
Delayed Warming in the Pacific Northwest • It appears that global warming’s effects will be delayed in the Northwest due to its proximity to the Pacific Ocean. • But eventually, GW will have a profound impact. • The best technology to determining local effects is downscaling general circulation model simulations using high resolution regional prediction models. • Such work is ongoing at the University of Washington
Large Drop in Snowpack in the Mountains Later in the Century
Precipitation Bottom Line: No Real Trend in Amounts or Extremes
The Precipitation ArgumentYou Often Hear As temperature increases, so will the amount of moisture in the atmosphere, and thus there will be more rain and heavy precipitation events
October to March Precipitation Over the Cascades From Stoelinga, Albright, Mass 2008
High Resolution Climate Simulation
Why Simple Arguments Could Fail • A number of theoretical, modeling, and observational studies have suggested that the jet stream will move northward under global warming. • Strong storms and heavy rainfall (pineapple express situations) tend to follow the jet stream. • It is possible that the “action” could move north of us under GW, with less major storms.
Is this already happening? • Several studies have found a decline in heavy precipitation over Oregon • The number of major windstorms has dropped over Oregon.
Summary • The evidence that the world will warm up profoundly due to greenhouse gas emissions is compelling. • The effects will not be uniform. • The Northwest is located downstream of the Pacific and thus will see lesser and delayed impacts. • So far, the impacts over the NW have been minimal. • By the end of the century even the NW will experience substantial warming and loss of snowpack, unless actions are taken now to stabilize and reduce greenhouse gas emissions.
Summary • The climate system is complex, so beware of simple arguments.