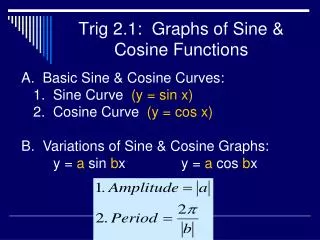
Trig Graphs
Trig Graphs. Investigate the effects of 2 sin(x), 2 cos(x), 2 tan(x) s in( 2 x), cos ( 2 x), tan( 2 x) s in(x) +1 , cos (x) +1 , tan(x) +1 - sin(x), - cos (x), - tan(x) sin(x -30 ), cos (x - 30 ),tan(x - 30 ). 2 sin(x), 2 cos(x), 2 tan(x).

Trig Graphs
E N D
Presentation Transcript
Trig Graphs Investigate the effects of 2sin(x), 2cos(x), 2tan(x) sin(2x), cos(2x), tan(2x) sin(x)+1, cos(x)+1, tan(x)+1 - sin(x), - cos(x), - tan(x) sin(x-30),cos(x-30),tan(x-30)
2sin(x), 2cos(x), 2tan(x) The 2sin(x) and 2cos(x) graphs are obviously twice as high, but still centred around the x-axis. The 2tan(x) graph does not show as marked a difference, but does appear slightly steeper.
sin(2x), cos(2x), tan(2x) Sin(x) and Cos(x) both complete a cycle in 360 degrees. Sin(2x) and Cos(2x) both complete a cycle in 180 degrees. The amplitude remains the same. The (2x) completes a cycle in 1/2 the time, while (3x) completes in 1/3 the time. Tan(x) completes a cycle in 180 degrees. Tan(2x) completes a cycle in 90 degrees.
sin(x)+1, cos(x)+1, tan(x)+1 The sin(x)+1 and cos(x)+1 graphs are moved vertically by 1. If the sign is negative, the graph would be moved down by that amount. Adding +1 and moving the tan graph up by 1 appears to make little difference.
- sin(x), -cos(x), - tan(x) The – sign in front of the sin or cos graph inverts the graph about the x axis, but does not alter the number of waves in 3600 or the altitude of the wave. The – sign in front of the tan graph also inverts the function about the x axis.
sin(x-30), cos(x-30), tan(x-30) The effect of the -30 is to shift the graph horizontally 300 in the opposite direction to what would seem logical i.e. positive(right). If the function was sin(x+30) then the graph would be shifted by 300 in the negative direction (left). This has the same visual effect across sin, cos and tan.
Trig Graph Summary Function Effect 2sin(x), 2cos(x), 2tan(x) Twice as high sin(2x), cos(2x), tan(2x) Twice as frequent sin(x)+1, cos(x)+1, tan(x)+1 Shift Vertically - sin(x), - cos(x), - tan(x) Invert sin(x-30), cos(x-30), tan(x-30) Shift Horiz (+left)(-right)