Training on measures…
Training on measures…. We strongly recommended that you watch these on demand videos because all directions, cover sheets , etc. are housed here. . OR. Universal Screening. Progress Monitoring (no separate Strategic Monitoring). New look and feel… . Key Features. What are the assessments?.

Training on measures…
E N D
Presentation Transcript
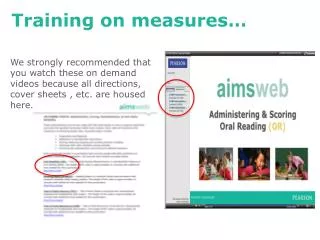
Training on measures… We strongly recommended that you watch these on demand videos because all directions, cover sheets , etc. are housed here. OR
What are the assessments? * Also available in Spanish
You are here View student details/ add tasks Browser Based Scoring View class/student PM data View class level data View norms Print materials/ manual data entry
You are here 2. Choose Benchmark or Progress Monitor 4. Choose week then refresh 1. Choose students to score 3. Choose measure Enter score manually Edit to enter oral reading scores or MCAP item analysis Enter notes/ absent Click to print supporting materials
Demo Account • https://training.aimsweb2.pearson.com or button on any Weebly page • Customer ID: 1280 or 1328 • Username: Johnson or Nguyen (teachers) • Password: Password1
BBS – cannot edit the score • Adding the ability to adjust after timer ends
You are here 2. Choose type of report 1. Choose students, grade, measure, criteria, report type 3. Click refresh Choose norm or cut scores Pink Alert to indicate need for PM or adjustment Gray Alert to indicate below or well below in a different measure Shows the progress monitor status towards goal Set up progress monitoring
Giving meaning to the National Norms Descriptors Percentiles 90 Well Above Average Range Above Average Range 75-90 Average Range (50% of scores) 25-75 Below Average Range 10-25 Well Below Average Range 0-10
Reading Common Core Report Ties students performance to Pearson curriculum
MCAP Analysis Expand
PM – built in Growth Norms • Found on Aimsweb website • http://www.aimsweb.com/roi-growth-norms • Or in Ver 1 software – Downloads tab • 1 page sample on Weebly site
Student Growth Percentiles Initial Performance Level (Starting Point) Very High 91-99th ROIs High 76th-90th Grade Average 26-75th Descriptions of Growth Ambitious >85 Closes the gap > 50-85 Insufficient <50 Low 11-25th Very Low 1-10th
Key Points for SGP Table • Student Growth Percentiles (SGP’s) were constructed based on five initial score levels that relate to the aimsweb national norms • -Very Low (1st–10th percentile) • -Low (11th–25th percentile) • -Average (26th–75th percentile) • -High (76th–90th percentile) • -Very High (91st–99th percentile) • For each initial level, the following terms describe the growth: • -85th-95th percentile: Ambitious • -55th-84th percentile: Closes the Gap • -Below 55th percentile: Insufficient
How are SGP’s used for goal setting? • System identifies the initial starting level by the baseline score and grade level chosen for the goal • Based on the relationship of the number of weeks and ending goal selected, the system calculates whether the slope of the goal line reflects an insufficient, closes the gap, or ambitious growth.
Summary of SGP’s Student Growth Percentiles (SGPs): • Allow schools to evaluate the progress of individual students relative to the rate of growth shown by students with similar initial scores in a national norm sample • Controls for level to make a fair comparison • aimswebbuilt this data into the slider bars so that no calculations on the part of the educator were necessary.
ON grade level monitoring Comparison: national norms Set up monitoring schedule and goal
Step 2: Set on level goal and schedule for student… Goal is not rigorous enough to catch the student up Goal is enough to move the student forward Goal is designed to help the student catch up
Set Intervention • Interventions can be pre-loaded or added into the software • Set up intervention duration and frequency
Off grade level monitoring Comparison: national norms Set up monitoring schedule and goal
Drop Down Method (was SLA) Process of testing students at successively lower grade levels to find the appropriate level for progress monitoring **Users must test students using the paper and pencil method when conducting the drop down method
Set off grade level goals and schedule for student… • Enter Baseline score from drop back method • Choose grade level • Follow the previous steps for setting up schedule and interventions
Progress Monitoring Caseload Circles indicate missed/”A” indicated absent Stars mean student has met goal Bars show trend of the data
Elements of the PM Graph Projection Line Aim Line Corrects Errors Progress bar