Download
1 / 16
160 likes | 319 Vues
Economic Integration Among The Asia-pacific Economic Cooperation Countries. By: Alan Meyer. Introduction. APEC – Trade union formed by fourteen countries in 1989. Three Regions. America – United States, Canada, and Mexico

E N D
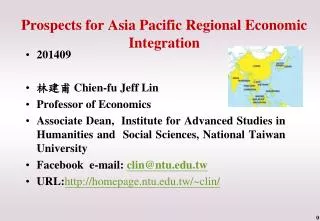
Economic Integration Among The Asia-pacific Economic Cooperation Countries By: Alan Meyer
Introduction • APEC – Trade union formed by fourteen countries in 1989
Three Regions • America – United States, Canada, and Mexico • Asia- Japan, South Korea, Taiwan, Hong Kong, Singapore, Malaysia, Thailand, Indonesia, and the Philippines • Pacific – Australia and New Zealand
APEC • Promotes open regionalism rather than preferential trade approach to both member and non-member nations • Agreed to form free trade area for developed nations by 2010 and developing nations by 2020
Free Trade Area • Trade Liberalization, economic, and technical cooperation: involves tariff and non-tariff reductions such as custom procedures, rules of origin, standards and conformance, and competition policy
Increasing Growth • Allowed inclusion of major nations globally • Started to form strong ties with the European Union
Objectives • Test Linder hypothesis on the APEC developed and developing countries for 1985-1999. • Examine the effect of the Free Trade Area on bilateral trade flows between the member countries.
Methodology • The gravity model – estimate trade flows between two countries • Income would have a positive effect on trade while geographical distance would have a negative effect. • Population and regional dummy variables
Gravity Model • Estimated for the entire period(1985-1999) and three sub-periods (1985-1989, 1990-1994, and 1995-1999). • Estimated for three country groups: Low-income, High-income, Different-Income
Equation • Log(Tradeij) = Bo + B1(logGDPi) + B2(logGDPj) + B3(logDist) + B4(logGDPCi – logGDPCj)2 +eij
Tradeij-export values from country i to country j • GDPi & GDPj –incomes of exporting and importing countries • Distij – physical distance between importing and exporting country • (logGDPCj – logGDPCj)2 – measures the income similarity effect where GDPC=GDP per capita
Linder Hypothesis • Income similarity effect would be on high income countries because they produce tradeable goods • In this study: United States, Canada, Japan, Australia, Singapore, and Hong Kong are high-income • New Zealand, Malaysia, South Korea, China, Indonesia, Mexico, the Philippines, and Thailand are low-income
Results for Entire Period • Explained for 65% of the variation in trade flows • Income similiarity effect is only confirmed for the high-income countries. Negative and significant throughout regression • Low-income countries have a positive coefficient and is insignificant
Results for Three Sub-Periods • High-Income countries have established close trade even before APEC was formed • Income similarity effect increased substantially with implementation of FTA in 1994 • Low-income countries did not increase trade. • High-income to Low-income trade increased slightly after 1994
Results of the Equation • GDP- trade will increase directly with income but is higher for different income countries and high-income countries • Distance – negative for all three country groups, highest in low-income countries
Conclusions • Income similarity effect is only consistent in high-income countries