Download
1 / 103
1.03k likes | 1.21k Vues
Back to Basics, 2010 POPULATION HEALTH (1): Introduction, Health Promotion, Biostats and Epi Methods. N Birkett, MD Epidemiology & Community Medicine Based on slides prepared by Dr. R. Spasoff Other resources available on Individual & Population Health web site. THE PLAN.

E N D
Back to Basics, 2010POPULATION HEALTH (1):Introduction, Health Promotion, Biostats and Epi Methods N Birkett, MD Epidemiology & Community Medicine Based on slides prepared by Dr. R. Spasoff Other resources available on Individual & Population Health web site
THE PLAN • These lectures are based around the MCC Objectives for Qualifying Examination • Emphasis is on core ‘need to know’ rather than on depth and justification • Focus is on topics not well covered in the Toronto Notes (UTMCCQE) • Three sessions: General Objectives & Infectious Diseases, Clinical Presentations, Additional Topics
THE PLAN(2) • First class • mainly lectures • Other classes • About 2 hours of lectures • Review MCQs for 60 minutes • A 10 minute break about half-way through • You can interrupt for questions, etc. if things aren’t clear.
THE PLAN (3) • Session 1 (March 30, 1230-1530) • Diagnostic tests • Sensitivity, specificity, validity, PPV • Health Promotion • Critical Appraisal • Intro to Biostatistics • Brief overview of epidemiological research methods
THE PLAN (4) • Session 2 (March 31, 0800-1130) • Clinical Presentations • Periodic Health Examination • Immunization • Occupational Health • Health of Special Populations • Disease Prevention • Determinants of Health • Environmental Health
THE PLAN (5) • Session 3 (April 1, 0800-1200) • Organization of Health Care Delivery in Canada • Elements of Health Economics • Vital Statistics • Overview of Communicable Disease control, epidemics, etc.
LMCC New Objectives (1) Population Health • Concepts of Health and Its Determinants (78-1) • Assessing and Measuring Health Status at the Population Level (78-2) • Interventions at the Population Level (78-3) • Administration of Effective Health Programs at the Population Level (78-4) • Outbreak Management (78-5) • Environment (78-6) • Health of Special Populations (78-7)
LMCC New Objectives (2) C2LEO (URL to LMCC objective page) • Considerations for • Cultural-Communication, Legal, Ethical and Organizational Aspects of the Practice of Medicine
LMCC New Objectives (3) • We won’t be able to cover every objective in detail. • Sessions will be based around objectives, with links identified as appropriate. • Start with some overviews.
LMCC New Objectives (4) 78.1: CONCEPTS OF HEALTH AND ITS DETERMINANTS • Define and discuss the concepts of health, wellness, illness, disease and sickness. • Describe the determinants of health and how they affect the health of a population and the individuals it comprises. • Lifecourse/natural history • Illness behaviour • Culture and spirituality
LMCC New Objectives (5) 78.1: CONCEPTS OF HEALTH AND ITS DETERMINANTS • Determinants of health include: • Income/social status • Social support networks • Education/literacy • Employment/working conditions • Social environments • Physical environments • Personal health practices/coping skills • Healthy child development • Biology/genetic endowment • Health services • Gender • Culture
LMCC New Objectives (6) 78.2: ASSESSING AND MEASURING HEALTH STATUS AT THE POPULATION LEVEL • Describe the health status of a defined population. • Measure and record the factors that affect the health status of a population with respect to the principles of causation • Principles of Epidemiology, critical appraisal, causation, etc.
LMCC New Objectives (7) 78.3: INTERVENTIONS AT THE POPULATION LEVEL • Understand three levels of prevention • Concepts of Health Promotion, etc. • Role of physicians at the community level. • Impact of public policy
LMCC New Objectives (8) 78.4: ADMINISTRATION OF EFFECTIVE HEALTH PROGRAMS AT THE POPULATION LEVEL • Structure of the Canadian Health Care System • Concepts of economic evaluation • Quality of care assessment
LMCC New Objectives (9) 78.5: OUTBREAK MANAGEMENT • Know defining characteristics of an outbreak • Demonstrate essential skills in outbreak control
LMCC New Objectives (10) 78.6: ENVIRONMENT • Recognize implications of environmental health at the individual and community levels • Know methods of information gathering • Work collaboratively with other groups • Recommend to patients and groups how they can minimize risk and maximize overall function
LMCC New Objectives (11) 78.7: HEALTH OF SPECIAL POPULATIONS • Specific target population include: • First Nations, Inuit, Métis Peoples • Global health and immigration • Persons with disabilities • Homeless persons • Challenges at the extremes of the age continuum
LMCC New Objectives (12) C2LEO • Same material as before but re-structured. • Read objectives for the details
Getting Started • We can’t cover everything. • Will concentrate on topics not well covered in the Toronto notes and material of greatest importance. • Material will ‘jump around’ a bit • Material won’t flow by LMCC objectives but rather by content links.
INVESTIGATIONS (1) • 78.2 • Determine the reliability and predictive value of common investigations • Applicable to both screening and diagnostic tests.
Reliability • = reproducibility. Does it produce the same result every time? • Related to chance error • Averages out in the long run, but in patient care you hope to do a test only once; therefore, you need a reliable test
Validity • Whether it measures what it purports to measure in long run, viz., presence or absence of disease • Normally use criterion validity, comparing test results to a gold standard • Link to I&PH web on validity
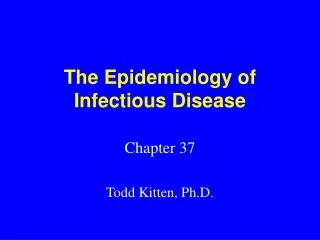
Reliability and Validity: the metaphor of target shooting.Here, reliability is represented by consistency, and validity by aim Reliability LowHigh • • • • • • • • Low Validity • • • • • • • • High • • • • • • • •
Gold Standards • Possible gold standards: • More definitive (but expensive or invasive) test • Complete work-up • Eventual outcome (for screening tests, when workup of well patients is unethical; in clinical care you cannot wait) • First two depend upon current state of knowledge and available technology
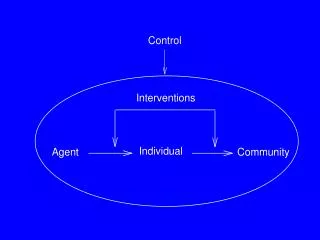
Test Properties (1) True positives False positives False negatives True negatives
Test Properties (2) Sensitivity = 0.90 Specificity = 0.95
2x2 Table for Testing a Test Gold standard Disease Disease Present Absent Test Positive a (TP) b (FP) Test Negative c (FN) d (TN) Sensitivity Specificity = a/(a+c) = d/(b+d)
Test Properties (6) • Sensitivity = Pr(test positive in a person with disease) • Specificity = Pr(test negative in a person without disease) • Range: 0 to 1 • > 0.9: Excellent • 0.8-0.9: Not bad • 0.7-0.8: So-so • < 0.7: Poor
Test Properties (7) • Values depend on cutoff point • Generally, high sensitivity is associated with low specificity and vice-versa. • Not affected by prevalence, if severity is constant • Do you want a test to have high sensitivity or high specificity? • Depends on cost of ‘false positive’ and ‘false negative’ cases • PKU – one false negative is a disaster • Ottawa Ankle Rules
Test Properties (8) • Sens/Spec not directly useful to clinician, who knows only the test result • Patients don’t ask: if I’ve got the disease how likely is it that the test will be positive? • They ask: “My test is positive. Does that mean I have the disease?” • Predictive values.
Test Properties (9) PPV = 0.95 NPV = 0.90
2x2 Table for Testing a Test Gold standard Disease Disease Present Absent Test + a (TP) b (FP) PPV = a/(a+b) Test - c (FN) d (TN) NPV= d/(c+d) a+c b+d
Predictive Values • Based on rows, not columns • PPV = a/(a+b); interprets positive test • NPV = d/(c+d); interprets negative test • Depend upon prevalence of disease, so must be determined for each clinical setting • Immediately useful to clinician: they provide the probability that the patient has the disease
Prevalence of Disease • Is your best guess about the probability that the patient has the disease, before you do the test • Also known as Pretest Probability of Disease • (a+c)/N in 2x2 table • Is closely related to Pre-test odds of disease: (a+c)/(b+d)
Test Properties (10) prevalence odds
Prevalence and Predictive Values • Predictive values for a test dependent on the pre-test prevalence of the disease • Tertiary hospitals see more pathology then FP’s; hence, their tests are more often true positives. • How to ‘calibrate’ a test for use in a different setting? • Relies on the stability of sensitivity & specificity across populations.
Methods for Calibrating a Test Four methods can be used: • Apply definitive test to a consecutive series of patients (rarely feasible) • Hypothetical table • Bayes’s Theorem • Nomogram You need to be able to do one of the last 3. By far the easiest is using a hypothetical table.
Calibration by hypothetical table Fill cells in following order: “Truth” Disease Disease Total PV Present Absent Test Pos 4th 7th 8th 10th Test Neg 5th 6th 9th 11th Total 2nd 3rd 1st (10,000)
Test Properties (12) Tertiary care: research study. Prev=0.5 PPV = 0.89 Sens = 0.85 Spec = 0.90
Test Properties (13) Primary care: Prev=0.01 1,075 85 990 0.85*100 PPV = 0.08 15 8,910 8,925 0.9*9900 9,900 100 0.01*10000
Calibration by Bayes’ Theorem • You don’t need to learn Bayes’ theorem • Instead, work with the Likelihood Ratio (+ve).
Test Properties (9) Post-test odds = 18.0 Pre-test odds = 1.00 Likelihood ratio (+ve) = LR(+) = 18.0/1.0 = 18.0
Calibration by Bayes’s Theorem • You can convert sens and spec to likelihood ratios • LR+ = sens/(1-spec) • LR+ is fixed across populations just like sensitivity & specificity. • Bigger is better. • Posttest odds = pretest odds * LR+ • Convert to posttest probability if desired…
Calibration by Bayes’s Theorem • How does this help? • Remember: • Post-test odds = pretest odds * LR (+) • To ‘calibrate’ your test for a new population: • Use the LR+ value from the reference source • Compute the pre-test odds for your population • Compute the post-test odds • Convert to post-test probability to get PPV
Converting odds to probabilities • Pre-test odds = prevalence/(1-prevalence) • if prevalence = 0.20, then pre-test odds = .20/0.80 = 0.25 • Post-test probability = post-test odds/(1+post-test odds) • if post-test odds = 0.25, then prob = .25/1.25 = 0.2
Example of Bayes’s Theorem(‘new’ prevalence 1%, sens 85%, spec 90%) • LR+ = .85/.1 = 8.5 (>1, but not that great) • Pretest odds = .01/.99 = 0.0101 • Positive Posttest odds = .0101*8.5 = .0859 • PPV = .0859/1.0859 = 0.079 = 7.9% • Compare to the ‘hypothetical table’ method (PPV=8%)
Calibration with Nomogram • Graphical approach avoids some arithmetic • Expresses prevalence and predictive values as probabilities (no need to convert to odds) • Draw lines from pretest probability (=prevalence) through likelihood ratios; extend to estimate posttest probabilities • Only useful if someone gives you the nomogram!
Example of Nomogram(pretest probability 1%, LR+ 45, LR– 0.102) 1% 45 31% .102 0.1% LR Pretest Prob. Posttest Prob.
INVESTIGATIONS (2) What is the effect of demographic considerations on the sensitivity and specificity of diagnostic tests? • Generally, assumed to be constant. BUT….. • Sensitivity and specificity usually vary with severity of disease, and may vary with age and sex • Therefore, you can use sensitivity and specificity only if they were determined on patients similar to your own • Spectrum bias
The Government is extremely fond of amassing great quantities of statistics. These are raised to the nth degree, the cube roots are extracted, and the results are arranged into elaborate and impressive displays. What must be kept ever in mind, however, is that in every case, the figures are first put down by a village watchman, and he puts down anything he damn well pleases! Sir Josiah Stamp, Her Majesty’s Collector of Internal Revenue.