Download
1 / 181
1.88k likes | 2.24k Vues
CPH EXAM REVIEW– EPIDEMIOLOGY. Lina Lander, Sc.D. Associate Professor Department of Epidemiology, College of Public Health University of Nebraska Medical Center January 24, 2014. Review of basic topics covered in the epidemiology section of the exam

E N D
CPH EXAM REVIEW– EPIDEMIOLOGY Lina Lander, Sc.D. Associate Professor Department of Epidemiology, College of Public Health University of Nebraska Medical Center January 24, 2014
Review of basic topics covered in the epidemiology section of the exam • Materials covered cannot replace basic epidemiology course • This review will be archived on the NBPHE website under Study Resources www.nbphe.org
Outline • Overview • Terminology • Study design • Causation and validity • Screening
Populations Group of people with a common characteristic • Place of residence, age, gender, religion • People who live in Omaha, Nebraska in January, 2014 • Occurrence of a life event (undergoing cancer treatment, giving birth)
Populations • Membership can be permanent or transient • Population with permanent membership is referred to as “Fixed” or “Closed” • People present at Hiroshima • Passengers on an airplane • Population with transient membership is referred to as “Dynamic” or “Open” • Population of Omaha
Measures of Frequency “Count” - the most basic epidemiologic measure • Expressed as integers (1, 2, 3, …) • Answers the question, “How many people have this disease?” • Often the numerator of many measures • Important to distinguish between incident (new) and prevalent (existing) cases
Ratio • One number (x) divided by another (y): • Range: zero (0) to infinity (∞) • (x) and (y) may be related or completely independent • Sex of children • Attending a clinic
Which of the following terms is expressed as a ratio (as distinguished from a proportion)? (A) Male Births / Male + Female Births (B) Female Births / Male + Female Births (C) Male Births / Female Births (D) Stillbirths / Male + Female Births
Proportion • Ratio in which the numerator (x) is included in the denominator (x+y): • Range: zero (0) to one (1) • Often expressed as percentage ( e.g., Among all children who attended a clinic, what proportion was female?
Rate • Can be expressed as (a/T) where (a) = cases and (T) involves a component of time • Range: zero (0) to infinity (∞) • Measures speed at which things happen • Rate of at-risk females coming to a clinic (time)
Prevalence • Proportion • Not a rate – no time component in the calculation • Measures proportion of existing disease in the population at a given time • “Snapshot” • Dimensionless, positive number (0 to 1)
Prevalence proportion Where: A = number of existing cases B = number of non-cases N = total population
Incidence • Measures the occurrence of new cases in a population at risk over time • Can be measured as a proportion or a rate • The most fundamental epidemiologic indicator • Measures force of morbidity (as a rate) • Measures conversion of health status (proportion /rate)
Incidence proportion • Synonyms: incidence, cumulative incidence, risk • Measures probability (risk) of developing disease during period of observation • Dimensionless, positive number (0 to 1)
Incidence Proportion Where: a= number of new onset cases (events) N = population-at-risk at beginning
Incidence Proportion • Appropriate for fixed (closed) populations and short follow-up • Must specify time period of observationbecause risk changes with time • Not appropriate for long-term follow-up due to potential loss of subjects • Assuming: complete follow-up, same risk over time
Follow 2000 newborns at monthly intervals to measure development of respiratory infection in the first year • Suppose 50 infants develop respiratory infection in first year of life • The risk (probability) of developing a respiratory infection in the first year of life is ~ 2.5% • 25 of 1000 infants in this population or 1 in 40 will develop infection in the first year of life.
Incidence Rate • Measures how rapidly new cases develop during specified time period • Cases per person-time • Synonyms: incidence, incidence density, rate • Follow-up may be incomplete • Risk period not the same for all subjects
Incidence Rate Where: a = number of new onset cases T = person-time at risk during study period (follow-up)
Person-time • Accounts for all the time each person is in the population at risk • The length of time for each person is called person-time • Sum of person-times is called the total person-time at risk for the population
Person-time T = person-time at risk during study period = 1+5+5+3+2 = 16 person-years
Person-time Assumption • 100 persons followed 10 years = 1000 person years • 1000 persons followed for 1 year = 1000 person years
Follow 2000 newborns at monthly intervals to measure development of respiratory infection in the first year 50 infants develop respiratory infection 1900 complete the first year disease free 25 complete 3 months (0.25 years) before infection 25 complete 6 months (0.5 years) before infection Calculate incidence rate: = 2.6 per 100 person-years
Incidence, Prevalence, Duration • Prevalence increases as new cases added to the existing cases (i.e., incidence) • Prevalence decreases as people are cured or die • Prevalence = Incidence * Duration
Mortality • Measures the occurrence death • Can be measured as a proportion or a rate • Can measure disease severity or effectiveness of treatment
Mortality Rate • Measures rate of death in the population over a specified amount of time • Positive number (0 to ∞) • Can be a measure of incidence rate (risk) when disease is severe and fatal, e.g. pancreatic cancer • Synonym: fatality rate
Mortality Rate Where: d = number of deaths N = total population at mid-point of time period T = follow-up time (usually one year)
Cancer Death Rates*, for Men, US, 1930-2003 *Age-adjusted to the 2000 US standard population. Source: US Mortality Public Use Data Tapes 1960-1999, US Mortality Volumes 1930-1959, National Center for Health Statistics, Centers for Disease Control and Prevention, 2002.
Case Fatality Rate • This is not a rate, this is a proportion • Proportion of deaths from a specific illness Case Fatality Rate Where: a = Number of deaths from an illness N = Number of people with that illness What percentage of people diagnosed as having a disease die within a certain time after diagnosis?
Case-fatality rate • Case-fatality – a measure of the severity of the disease • Case-fatality – can be used to measure benefits of a new therapy • As therapy improves - the case-fatality rate would be expected to decline • e.g. AIDS deaths with the invention of ARVs
Proportionate Mortality • Of all deaths, the proportion caused by a certain disease • Can determine the leading causes of death • Proportion of cause-specific death is dependent on all other causes of death • This does not tell us the risk of dying from a disease Proportionate mortality from Cardiovascular Disease in the U.S, in 2013 = # of U.S deaths from cardiovascular diseases in 2013x 1,000 Total deaths in the U.S. for 2013
Which measure of mortality would you calculate to determine the proportion of all deaths that is caused by heart disease? (A) Case fatality (B) Cause-specific mortality rate (C) Crude mortality rate (D) Proportionate mortality ratio (E) Potential years of life lost
Other Mortality Rates • Crude Mortality Rate • Includes all deaths, total population, in a time period • Cause-Specific Mortality Rate • Includes deaths from a specific cause, total population, in a time period • Age-Specific Mortality Rate • Includes all deaths in specific age group, population in the specific age group, in a time period
Mortality Rates (Year = 2000) Panama Sweden Why do you think Sweden has almost a 2x higher mortality rate? Population = 2,899,513 Deaths = 13,483 Mortality Rate = 4.65 per 1000 per year Population = 8,923,569 Deaths = 93,430 Mortality Rate = 10.47 per 1000 per year
Differences in Mortality Rates Crude mortality rates do not take into account differences between populations such as age
Can we remove this confounding by age? • Separate (stratify) the population into age groups and calculate rates for each age • Compare age-specific mortality rates • If two different populations, adjust (standardize) the mortality rates of the two populations, taking into account the age structures • Results in comparable rates between populations or in the same population over time
Direct Standardization • If the age composition of the populations were the same, would there be any differences in mortality rates? • Direct age adjustment is used to remove the effects of age structure on mortality rates in two different populations • Apply actual age-specific rates to a standard population (US population 2000)
Indirect Standardization • When age-specific rates are not available – use age-specific mortality rates from the general population to calculate expected number of deaths Standardized mortality ratios (SMR) = observed deaths/ expected deaths • If the age composition of the populations were the same, would there be any differences in mortality rates?
Study Design • Experimental studies (Clinical Trial, Randomized Controlled Trial) • Observational studies • Cohort • Case-control • Cross-sectional • Ecological
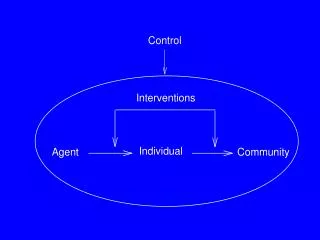
Experimental studies are characterized by: • The population under study: who is eligible for study entry? • The intervention(s) being used or compared: what treatment(s) are being used? (Therapeutic (e.g., drug) or preventive (e.g., education) • The method of treatment assignment: how are subjects assigned to intervention(s)? • The outcomes of interest: how will success be measured?
Randomized Controlled Trials • A randomized controlled trial is a type of experimental research design for comparing different treatments, in which the assignment of treatments to patients is made by a random mechanism. • Customary to present table of patient characteristics to show that the randomization resulted in a balance in patient characteristics.
Steps in carrying out a clinical trial • Select a sample from the population • Ethical considerations • Measure baseline variables • Randomize • Apply interventions • Follow up the cohorts • Measure outcome variables (blindly, if possible)
Use of “Blinding” • Important when knowing treatment could influence the interpretation of results • Especially important when outcomes are subjective (pain, functional status) and/or when placebo is employed (either alone or to mask actual treatment) • Placebo- ensure control and treatment group have same “experience” • May not be necessary if the outcome is an object measure (death, blood glucose)
Treat • Blinding of the participants to which treatment was used ensures that bias is avoided • Single-blind: patient does not know what treatment they are receiving • Double–blind: patient and investigator do not know what treatment (cannot be used for some treatments, e.g. surgery)