Enterprise Valuation Frameworks for Financial Management
130 likes | 251 Vues
Learn about discounted cash flow and economic profit to optimize capital structure. Analyze models for valuable insights.

Enterprise Valuation Frameworks for Financial Management
E N D
Presentation Transcript
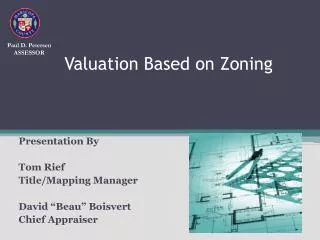
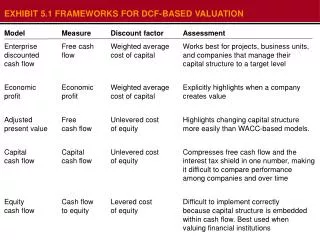
Enterprise discounted cash flow • Free cash flow • Weighted average • cost of capital • Works best for projects, business units, and companies that manage their capital structure to a target level • Economic profit • Economic profit • Weighted average • cost of capital • Explicitly highlights when a company creates value • Adjusted present value • Free cash flow • Unlevered cost of equity • Highlights changing capital structure more easily than WACC-based models. • Capital cash flow • Capital cash flow • Unlevered cost of equity • Compresses free cash flow and the interest tax shield in one number, making it difficult to compare performance among companies and over time • Equity cash flow • Cash flow to equity • Levered cost of equity • Difficult to implement correctly because capital structure is embedded within cash flow. Best used when valuing financial institutions LAN-ZWB887-20050620-13749-ZWB EXHIBIT 5.1 FRAMEWORKS FOR DCF-BASED VALUATION • Model • Measure • Discount factor • Assessment
LAN-ZWB887-20050620-13749-ZWB EXHIBIT 5.2 ENTERPRISE VALUATION OF A SINGLE-BUSINESS COMPANY • $ Million • Free cash flow from operations • Discount free cash flow by the weighted average cost of capital • Economic assets generate operating cash flow = • 427.5 • 427.5 • Enter-prise value • After-tax cash flow to debt holders • Debt value • 200.0 + • Financial claims on the company’s operating cash flow • Cash flow equity holders • Equity value • 227.5 • Year • 1 • 2 • 3 • 4 • 5 * Debt value equals discounted after-tax cash flow to debt holders plus present value of interest tax shield
LAN-ZWB887-20050620-13749-ZWB EXHIBIT 5.3 ENTERPRISE VALUATION OF A MULTIBUSINESS COMPANY • $ Million • Unit A • Unit B • Unit C • Corporate center • Excess cash • Enterprise cash • Value of debt • Equity value • Value of operating units
LAN-ZWB887-20050620-13749-ZWB EXHIBIT 5.4 HOME DEPOT: ENTERPRISE DCF VALUATION • Free cash flow (FCF) • $ Million • Discount factor • @ 9.3% • Present value of FCF • $ Million • Year • 2004 • 2005 • 2006 • 2007 • 2008 • 2009 • 2010 • 2011 • 2012 • 2013 • Continuing value • 1,930 • 2,219 • 2,539 • 2,893 • 3,283 • 3,711 • 4,180 • 4,691 • 5,246 • 5,849 • 133,360 • 0.915 • 0.837 • 0.766 • 0.700 • 0.641 • 0.586 • 0.536 • 0.491 • 0.449 • 0.411 • 0.411 • 1,766 • 1,857 • 1,944 • 2,026 • 2,104 • 2,175 • 2,241 • 2,301 • 2,355 • 2,402 • 54,757 • Present value of cash flow • 75,928 • Mid-year adjustment factor • 1,046 • Value of operations • 79,384 • Value of excess cash • Value of other nonoperating assets • 1,609 • 84 • Enterprise value • 81,077 • (1,365) • (6,554) • Value of debt • Value of capitalized operating leases • Equity value • 73,158 • Number of shares (at fiscal year-end 2003, million) • 2,257 • Estimated share value (Dollars) • 32.41
LAN-ZWB887-20050620-13749-ZWB EXHIBIT 5.5 HOME DEPOT AND LOWE’S: HISTORICAL ROIC ANALYSIS • $ Million • Home Depot • Lowe’s • 2001 • 2002 • 2003 • 2001 • 2002 • 2003 • Net sales • Cost of merchandise sold • Selling, general and administrative • Depreciation • Operating lease interest • 53,553 • (37,406) • (10,451) • (756) • 288 • 58,247 • (40,139) • (11,375) • (895) • 260 • 64,816 • (44,236) • (12,658) • (1,075) • 276 • 22,111 • (15,743) • (4,053) • (517) • 106 • 26,491 • (18,465) • (4,859) • (626) • 106 • 30,838 • (21,231) • (5,671) • (758) • 114 • Adjusted EBITA • 5,228 • 6,098 • 7,123 • 1,904 • 2,647 • 3,292 • Adjusted taxes • (2,020) • (2,117) • (2,040) • (654) • (825) • (1,069) • NOPLAT • 3,208 • 3,981 • 5,083 • 1,250 • 1,822 • 2,223 • Invested capital • Operating working capital • Net property and equipment • Capitalized operating leases • Net other assets • 2,552 • 15,375 • 5,459 • (216) • 2,746 • 17,168 • 5,890 • (247) • 2,674 • 20,063 • 6,554 • (524) • 1,634 • 8,653 • 2,189 • 134 • 1,451 • 10,352 • 2,373 • 145 • 1,363 • 11,945 • 2,762 • 211 • Invested capital (excluding goodwill) • 23,170 • 25,557 • 28,767 • 12,611 • 14,321 • 16,281 • Acquired intangibles and goodwill • Cumulative amortization and • unreported goodwill • 419 • 46 • 575 • 54 • 833 • 55 • 0 • 730 • 0 • 730 • 0 • 730 • Invested capital (including goodwill) • 23,635 • 26,185 • 29,655 • 13,341 • 15,051 • 17,012 • ROIC excluding goodwill (average) • ROIC including goodwill (average) • 14.5% • 14.3% • 16.3% • 16.0% • 18.7% • 18.2% • 10.9% • 10.3% • 13.5% • 12.8% • 14.5% • 13.9%
LAN-ZWB887-20050620-13749-ZWB EXHIBIT 5.8 HOME DEPOT: FREE CASH FLOW SUMMARY • $ Million • Home depot • Lowe’s • 2003 • 2001 • 2002 • 2003 • 2001 • 2002 • NOPLAT • Depreciation • Gross cash flow • Investment in operating working capital • Net capital expenditures • Investment in capitalized operating leases • Investments in intangibles and goodwill • Decrease (increase) in other operating assets • Increase (decrease) in accumulated other • comprehensive income • Gross investment • Free cash flow • 3,208 • 756 • 3,964 • 834 • (3,063) • (775) • (113) • 105 • (153) • (3,165) • 799 • 3,981 • 895 • 4,876 • (194) • (2,688) • (430) • (164) • 31 • 138 • (3,307) • 1,569 • 5,083 • 1,075 • 6,157 • 72 • (3,970) • (664) • (259) • 277 • 172 • (4,372) • 1,785 • 5,185 • 1,193 • 6,378 • (294) • (3,399) • (721) • (92) • 58 • 0 • (4,448) • 1,930 • 5,741 • 1,321 • 7,062 • (318) • (3,708) • (780) • (99) • 62 • 0 • (4,843) • 2,219 • 6,342 • 1,459 • 7,801 • (344) • (4,036) • (842) • (107) • 67 • 0 • (5,261) • 2,539
8.3 • 91.7 • 0.2 • 9.1 • 100.0 • 9.3 LAN-ZWB887-20050620-13749-ZWB EXHIBIT 5.10 HOME DEPOT: WEIGHTED AVERAGE COST OF CAPITAL Percent • Proportion of total capital • After-tax opportunity cost • Contribution to weighted average • Source of capital • Cost of capital • Marginal tax rate • Debt • Equity • 4.7 • 9.9 • 38.2 • 2.9 • 9.9 • WACC
LAN-ZWB887-20050620-13749-ZWB EXHIBIT 5.11 HOME DEPOT: ECONOMIC PROFIT SUMMARY $ Million, percent • Historical • Forecast • Method 1 • 2001 • 2002 • 2003 • 2004 • 2005 • 2006 • Return on invested capital • 15.0% • 16.8% • 19.4% • 17.5% • 17.4% • 17.4% • Weighted average cost of capital • 10.1% • 9.0% • 9.3% • 9.3% • 9.3% • 9.3% • Economic spread • 4.9% • 7.9% • 10.1% • 8.2% • 8.1% • 8.1% • 21,379 • Invested capital • 23,635 • 26,185 • 29,655 • 32,910 • 36,432 • Economic profit • 1,048 • 1,857 • 2,645 • 2,424 • 2,677 • 2,950 • Method 2 • Invested capital • 21,379 • 23,635 • 26,185 • 29,655 • 32,910 • 36,432 • Weighted average cost of capital • 10.1% • 9.0% • 9.3% • 9.3% • 9.3% • 9.3% • Capital charge • 2,159 • 2,124 • 2,438 • 2,761 • 3,064 • 3,392 • NOPLAT • 3,208 • 3,981 • 5,083 • 5,185 • 5,741 • 6,342 • Capital charge • 2,159 • 2,124 • 2,438 • 2,761 • 3,064 • 3,392 • Economic profit • 1,048 • 1,857 • 2,645 • 2,424 • 2,677 • 2,950
LAN-ZWB887-20050620-13749-ZWB EXHIBIT 5.12 HOME DEPOT: ECONOMIC PROFIT VALUATION • Invested • Capital* • $ Million • Economic profit • $ Million • Discount • factor • @ 9.3% • Present value of economic profit • $ Million • ROIC • Percent • WACC • Percent • Year • 0.915 • 2004 • 29,655 • 17.5 • 9.3 • 2,424 • 2,217 • 0.837 • 2005 • 32,910 • 17.4 • 9.3 • 2,677 • 2,241 • 0.766 • 2006 • 36,432 • 17.4 • 9.3 • 2,950 • 2,259 • 0.700 • 2007 • 40,235 • 17.4 • 9.3 • 3,242 • 2,271 • 0.641 • 44,329 • 17.3 • 9.3 • 3,556 • 2008 • 2,278 • 2009 • 48,729 • 17.3 • 9.3 • 3,890 • 2,281 • 0.586 • 2010 • 53,445 • 17.3 • 9.3 • 4,247 • 0.536 • 2,278 • 0.491 • 58,488 • 17.2 • 9.3 • 4,627 • 2011 • 2,270 • 0.449 • 63,870 • 17.2 • 9.3 • 5,031 • 2012 • 2,258 • 0.411 • 5,458 • 2013 • 69,600 • 17.2 • 9.3 • 2,241 • 0.411 • Continuing value • 57,671 • 23,679 • Present value of economic profit • 46,273 • Invested capital*2004 • 29,655 • Invested capital plus present value of economic profit • 75,928 • Mid-year adjustment factor • 1.046 • Value of operations • 79,384 • Value of excess cash • 1,609 • Value of other nonoperating assets • 84 • Enterprise value • 81,077 • Value of debt • (1,365) • Value of capitalized operating leases • (6,554) • Equity value • 73,158 * Invested capital is measured at the beginning of the year
LAN-ZWB887-20050620-13749-ZWB EXHIBIT 5.13 HOME DEPOT: VALUATION USING ADJUSTED PRESENT VALUE • Free cash flow$ Million • Interest • tax shield • (ITS) • Discount • factor • @ 9.5% • Present • value of FCF • $ Million • Present • value of ITS • $ Million • Year • 1,930 • 113 • 0.914 • 1,763 • 103 • 2004 • 1,852 • 100 • 2,219 • 120 • 0.835 • 2005 • 1,936 • 98 • 2006 • 2,539 • 128 • 0.763 • 2,016 • 95 • 2007 • 2,893 • 136 • 0.697 • 92 • 2008 • 2,090 • 3,283 • 145 • 0.636 • 89 • 2009 • 3,711 • 153 • 0.581 • 2,158 • 2010 • 86 • 4,180 • 162 • 0.531 • 2,220 • 83 • 2011 • 4,691 • 171 • 0.485 • 2,276 • 2,326 • 80 • 5,246 • 180 • 0.443 • 2012 • 2,369 • 77 • 5,849 • 189 • 0.405 • 2013 • 52,550 • 129,734 • 3,626 • 0.405 • 1,469 • Continuing value • 2,372 • 73,557 • Present value • Present value of FCF using unlevered cost of equity • 73,557 • Present value of interest tax shields (ITS) • 2,372 • Present value of FCF and ITS • 75,928 • Mid-year adjustment factor • 1.046 • Value of operations • 79,384 • Value of excess cash • 1,609 • Value of other nonoperating assets • 84 • Enterprise value • 81,077 • Value of debt • (1,365) • Value of capitalized operating leases • (6,554) • Equity value • 73,158
LAN-ZWB887-20050620-13749-ZWB EXHIBIT 5.14 HOME DEPOT: FORECAST OF INTEREST TAX SHIELDS • Prior year • net debt$ Million • Expected • interest rate • Percent • Interest • payment • $ Million • Marginal • tax rate • Percent • Interest • tax shield • $ Million • Year • 2004 • 6,310 • 4.7 • 295 • 38.2 • 113 • 2005 • 6,737 • 4.7 • 315 • 38.2 • 120 • 2006 • 7,179 • 4.7 • 336 • 38.2 • 128 • 2007 • 7,637 • 4.7 • 357 • 38.2 • 136 • 2008 • 8,107 • 4.7 • 379 • 38.2 • 145 • 2009 • 8,589 • 4.7 • 402 • 38.2 • 153 • 2010 • 9,081 • 4.7 • 425 • 38.2 • 162 • 2011 • 9,579 • 4.7 • 448 • 38.2 • 171 • 2012 • 10,081 • 4.7 • 472 • 38.2 • 180 • 2013 • 10,583 • 4.7 • 495 • 38.2 • 189 • Continuing value • 11,082 • 4.7 • 518 • 38.2 • 198
LAN-ZWB887-20050620-13749-ZWB EXHIBIT 5.15 HOME DEPOT: EQUITY CASH FLOW SUMMARY $ Million • Historical • Forecast • 2001 • 2002 • 2003 • 2004 • 2005 • 2006 • Net income • 3,044 • 3,664 • 4,304 • 4,796 • 5,318 • 5,882 • Depreciation • 756 • 895 • 1,075 • 1,193 • 1,321 • 1,459 • Amortization • 8 • 8 • 1 • 0 • 0 • 0 • Increase (decrease) in deferred taxes • (6) • 173 • 605 • 214 • 237 • 262 • Gross cash flow • 3,802 • 4,740 • 5,985 • 6,203 • 6,876 • 7,603 • 834 • (194) • 72 • (294) • (318) • (344) • Investment in operating working capital • Investment in net long-term assets • (3,224) • (2,683) • (3,780) • (3,433) • (3,745) • (4,076) • (1,509) • 383 • (473) • (177) • (191) • (207) • Decrease (increase) in excess cash • 9 • (24) • 23 • (9) • (10) • (11) • Investment in other nonoperating assets • Increase (decrease) in short-term debt • 207 • (211) • 509 • (44) • (54) • (66) • (295) • 71 • (465) • (73) • (91) • (112) • Increase (decrease) in long-term debt • Cash flow to equity • (176) • 2,082 • 1,871 • 2,173 • 2,466 • 2,788 • Dividends • 595 • 663 • 735 • 813 • 396 • 492 • Share repurchases (issued) • (572) • 1,276 • 1,510 • 1,731 • 1,975 • 1,590 • Cash flow to equity • (176) • 2,082 • 1,871 • 2,173 • 2,466 • 2,788
LAN-ZWB887-20050620-13749-ZWB EXHIBIT 5.16 HOME DEPOT: CASH-FLOW-TO-EQUITY VALUATION • Cash flow • to equity • $ Million • Discount • factor • @ 9.9% • Present value of CFE • $ Million • Year • 2004 • 2,173 • 0.910 • 1,978 • 2005 • 2,466 • 0.828 • 2,042 • 2006 • 2,788 • 0.754 • 2,101 • 2007 • 3,143 • 0.686 • 2,155 • 2008 • 3,530 • 0.624 • 2,203 • 2009 • 3,954 • 0.568 • 2,245 • 2010 • 4,416 • 0.517 • 2,282 • 2011 • 4,917 • 0.470 • 2,312 • 2012 • 5,459 • 0.428 • 2,336 • 2013 • 6,044 • 0.389 • 2,353 • Continuing value • 122,492 • 0.389 • 47,695 • Present value of cash flow • 69,702 • to equity • 3,456 • Midyear adjustment amount • Equity value • 73,158