Frameworks for Valuation
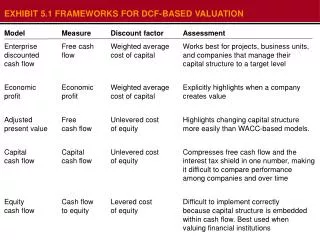
Frameworks for Valuation. Frameworks for DCF-Based Valuation. Model . Measure . Discount factor . Assessment . Enterprise discounted cash flow . Free cash flow. Weighted average cost of capital.

Frameworks for Valuation
E N D
Presentation Transcript
Frameworks for DCF-Based Valuation Model Measure Discount factor Assessment Enterprise discounted cash flow Free cash flow Weighted average cost of capital Works best for projects, business units, and companies that manage their capital structure to a target level Economic profit Economic profit Weighted average cost of capital Explicitly highlights when a company creates value Adjusted present value Free cash flow Unlevered cost of equity Highlights changing capital structure more easily than WACC-based models. Capital cash flow Capital cash flow Unlevered cost of equity Compresses free cash flow and the interest tax shield in one number, making it difficult to compare performance among companies and over time Equity cash flow Cash flow to equity Levered cost of equity Difficult to implement correctly because capital structure is embedded within cash flow. Best used when valuing financial institutions Using DCF to Value Companies • There are five well-known frameworks for valuing a company using DCF, the most common being enterprise DCF. • In theory, each framework will generate the same value. In practice, the ease of implementation and the interpretation of results varies across frameworks. • In this presentation, we examine how to value a company using each of the five frameworks.
The Valuation Process using Enterprise DCF 1. Analyze Historical Performance By thoroughly analyzing the past, we can document whether the company has created value, whether it has grown, and how it compares with its competitors. • Valuation is an iterative process… 5. Calculate and Interpret Results Once the model is complete, examine valuation results to ensure your findings are technically correct, your assumptions are realistic, and your interpretations plausible. 2. Forecast Financials & Cash Flows Project financials over the short and medium term. Short-term forecasts should be consistent with announced operating plans. Medium-term forecasts should focus on operating drivers, such as margins, and capital turnover. 4. Compute the Cost of Capital To value the enterprise, free cash flow is discounted by the weighted average cost of capital. The cost of capital is the blended rate of return for all sources of capital, specifically debt & equity. 3. Estimate a Continuing Value To forecast cash flows in the long-term future, use a perpetuity that focuses on the company’s key value drivers, specifically ROIC and growth. Begin the process by analyzing historical performance…
2001 2003 2002 Analyze Historical Performance: Analyzing ROIC • 1. Analyze Historical Performance • Before projecting future cash flow, examine the company’s historical performance. A good analysisfocuses on the key drivers of value: return on invested capital (ROIC) and growth. • ROIC measures a company’s ability to create value. • Both Home Depot and Lowe’s improved ROIC between 2001 and 2003. Historically speaking, Home Depot has performed better than Lowe’s. Going forward, will Home Depot be able to maintain this advantage? ROIC Analysis: Home Depot vs. Lowes Home Depot Lowe's How do we compute ROIC?
ROIC is computed by comparing after-tax operating profits to invested capital Analyze Historical Performance: Computing ROIC NOPLAT After-tax operating profit equals revenues minus operating costs, less any taxes that would have been paid if the firm held only core assets and were finance only with equity. Invested Capital Invested capital equals the operating assets required for core business activities (such as inventory and PP&E) less any financing provided by customers, employees, and suppliers (such as accounts payable). Home Depot Lowe’s 2003 2001 2002 2003 Net sales Cost of merchandise sold Selling, general and admin Depreciation Operating lease interest 53,553 (37,406) (10,451) (756) 288 64,816 (44,236) (12,658) (1,075) 276 58,247 (40,139) (11,375) (895) 260 30,838 (21,231) (5,671) (758) 114 Adjusted EBITA 5,228 7,123 6,098 3,292 Operating taxes (2,020) (2,117) (2,040) (1,069) 3,208 5,083 3,981 2,223 NOPLAT Invested capital Operating working capital Net property and equipment Capitalized operating leases Net other assets 2,552 15,375 5,459 (216) 2,674 20,063 6,554 (524) 2,746 17,168 5,890 (247) 1,363 11,945 2,762 211 Invested capital (w/o goodwill) 23,170 28,767 25,557 16,281 419 46 833 55 Intangibles and goodwill Cumulative amortization 575 54 0 730 29,655 26,185 17,012 23,635 Invested capital (w/ goodwill) ROIC w/ goodwill (average) 14.3% 16.0% 18.2% 13.9%
Forecast Financials: ROIC versus WACC • 2. Forecast Financials • To compute a company’s value using enterprise DCF, future free cash flow is discounted by the weighted average cost of capital. Rather than forecast FCF directly, however, forecast the financials that drive free cash flow. • One of the primary drivers of free cash flow is return on invested capital. For simplicity, we assume each company’s financial performance will remain constant. In actuality, these figures will change over time, and this must be modeled. Forecasting ROIC: Home Depot versus Lowe’s
Forecast Historical 2005 2001 2002 2003 2004 2006 NOPLAT Depreciation 6,342 1,459 5,741 1,321 3,208 756 3,981 895 5,083 1,075 5,185 1,193 Gross cash flow 4,876 3,964 6,157 6,378 7,801 7,062 Investment in operating working capital Net capital expenditures Investment in capitalized operating leases Investments in intangibles and goodwill Decrease (increase) in net other assets Increase (decrease) in other comp income (318) (3,708) (780) (99) 62 0 834 (3,063) (775) (113) 105 (153) (194) (2,688) (430) (164) 31 138 72 (3,970) (664) (259) 277 172 (344) (4,036) (842) (107) 67 0 (294) (3,399) (721) (92) 58 0 Gross investment (3,307) (4,372) (3,165) (4,448) (4,843) (5,261) Free cash flow ($ millions) 1,930 799 1,569 1,785 2,219 2,539 Forecast Financials: Free Cash Flow • Forecast Free Cash Flow (FCF) • Free cash flow, which is driven by revenue growth and return on invested capital, provides the basis for enterprise DCF valuation. • The computation of FCF should be consistent with that of ROIC. Free cash flow begins with NOPLAT, adds depreciation, and subtracts investments in invested capital. Gross Cash Flow Investments in Invested Capital NOPLAT plus depreciation, less investments in invested capital
Continuing Value • 3. Continuing Value • To estimate a company’s value, we separate a company’s expected cash flow into two periods and define the company’s value as follows: Present Value of Cash Flow during Explicit Forecast Period + Value = Present Value of Cash Flow after Explicit Forecast Period • The second term is the continuing value: the value of the company’s expected cash flow beyond the explicit forecast period. Explicit Forecast Period Continuing Value
Continuing Value: The Key Value Driver Formula • Although many continuing-value models exist, we prefer the key value driver model. The key value driver formula is superior to alternative methodologies because it is based on cash flow and links cash flow to growth and ROIC. g RONIC 1 - RONIC is the return on new investment, return on existing investment is captured in NOPLAT NOPLATt + 1 Continuing valuet = WACC - g 4.0% 9.3% 1 - $12,415 Continuing valuet = 9.3% - 4.0% The continuing value is measured as of 2013. This value must still be discounted to present day. = $133,360
Weighted Average Cost of Capital • 4. Weighted Average Cost of Capital • When performing and Enterprise DCF, make sure to choose the cash flows and discount factor consistently. Since free cash flows are the cash flows available to all investors, the discount factor for free cash flow must represent the risk faced by all investors. • The weighted average cost of capital (WACC) blends the required rates of return for debt kd and equity ke based on their target market values. Target (market-based) weights on debt and equity Home Depot Cost of Capital After-tax opportunity cost Contribution to weighted average Proportion of total capital 0.2 9.1 2.9 9.9 8.3 91.7 100.0% 9.3% After-tax cost of equity After-tax cost of debt
Putting It all Together: Enterprise DCF Valuation Home Depot Valuation Discount factor @ 9.3% Free cash flow (FCF) $ Million Present value of FCF $ Million Year 1,766 1,857 1,944 2,026 2,104 2,175 2,241 2,301 2,355 2,402 54,757 0.915 0.837 0.766 0.700 0.641 0.586 0.536 0.491 0.449 0.411 0.411 2004 2005 2006 2007 2008 2009 2010 2011 2012 2013 Continuing value 1,930 2,219 2,539 2,893 3,283 3,711 4,180 4,691 5,246 5,849 133,360 To determine the value of operations, discount free cash flow at the weighted average cost of capital. To determine the enterprise value, add the value of non-operating assets, such as excess cash. 75,928 Present value of cash flow 1,046 Mid-year adjustment factor 79,384 Value of operations 1,609 84 Value of excess cash Value of other nonoperating assets To determine the equity value, subtract the value of non-equity financial claims, such as debt and capitalized operating leases. 81,077 Enterprise value (1,365) (6,554) Value of debt Value of capitalized operating leases 73,158 Equity value
Frameworks for DCF-Based Valuation Model Measure Discount factor Assessment Enterprise discounted cash flow Free cash flow Weighted average cost of capital Works best for projects, business units, and companies that manage their capital structure to a target level Economic profit Economic profit Weighted average cost of capital Explicitly highlights when a company creates value Adjusted present value Free cash flow Unlevered cost of equity Highlights changing capital structure more easily than WACC-based models. Capital cash flow Capital cash flow Unlevered cost of equity Compresses free cash flow and the interest tax shield in one number, making it difficult to compare performance among companies and over time Equity cash flow Cash flow to equity Levered cost of equity Difficult to implement correctly because capital structure is embedded within cash flow. Best used when valuing financial institutions Economic Profit Valuation Models • The economic profit model highlights how and when the company creates value yet leads to a valuation that is identical to that of enterprise DCF. • An advantage of the economic profit model over the DCF model is that economic profit is a useful measure for understanding a company’s performance in any single year, whereas free cash flow is not.
Defining Economic Profit • Economic profit translates size, return on capital, and cost of capital into a single measure. Economic profit equals the spread between the return on invested capital and the cost of capital times the amount of invested capital. Economic profit = Invested Capital x (ROIC – WACC) • The above formula for economic profit can be rearranged and defined as after-tax operating profits less a charge for the capital used by the company: Economic profit = NOPLAT - (Invested Capital x WACC) • This approach shows that economic profit is similar in concept to accounting net income, but it explicitly charges a company for all its capital, not just the interest on its debt.
2002 2004 E 2001 2003 Method 1 ROIC 16.8% 15.0% 19.4% 17.5% 9.0% 10.1% 9.3% - WACC 9.3% = Economic spread 7.9% 4.9% 10.1% 8.2% X Invested capital 21,379 23,635 26,185 29,655 = Economic profit ( in $ millions) 1,857 1,048 2,645 2,424 2002 2004 E 2001 2003 Method 2 Invested capital 23,635 21,379 26,185 29,655 WACC 9.0% 10.1% 9.3% 9.3% Capital charge 2,124 2,159 2,438 2,761 NOPLAT 3,981 3,208 5,083 5,185 Capital charge (2,124) (2,159) (2,438) (2,761) Economic profit 1,857 1,048 2,645 2,424 Economic Profit at Home Depot • Consider both measures of economic profit for Home Depot. Since Home Depot has been earning returns greater than its cost of capital, its historical economic profit is positive. • Not every company has a positive economic profit. In fact many companies earn an accounting profit (net income greater than zero), but can’t earn their cost of capital.
Discounted Economic Profit Leads to Same Results as DCF • To demonstrate how economic profit can be used to value a company—and to demonstrate its equivalence to enterprise DCF, consider a stream of growing cash flows valued using the growing-perpetuity formula, • Using a few algebraic transformations and the assumption that the company’s ROIC on new projects equals the company’s current ROIC, we can transform the cash flow perpetuity into an economic-profit based key value driver model, • Substituting the definition of economic profit,
Home Depot: Economic Profit Valuation Home Depot Valuation Present value of economic profit $ Million Economic profit $ Million Discount factor @ 9.3% Invested Capital $ Million WACC Percent ROIC Percent Year 2004 29,655 17.5 9.3 2,424 0.915 2,217 The value of operations equals: the sum of discounted economic profit 0.837 2,677 17.4 32,910 2,241 9.3 2005 0.766 2,950 17.4 36,432 2,259 9.3 2006 0.700 3,242 17.4 40,235 2,271 9.3 2007 0.641 3,556 17.3 44,329 2,278 9.3 2008 3,890 17.3 0.586 48,729 2,281 9.3 2009 4,247 17.3 0.536 53,445 2,278 9.3 2010 0.491 4,627 17.2 58,488 2,270 9.3 2011 + 0.449 5,031 17.2 63,870 2,258 9.3 2012 0.411 5,458 current invested capital 69,600 2,241 9.3 17.2 2013 57,671 0.411 23,679 Continuing value 46,273 Present value of economic profit 29,655 Invested capital*2004 75,928 Economic Profit leads to the same value for operations as Enterprise DCF! Invested capital plus present value of economic profit 1.046 Mid-year adjustment factor 79,384 Value of operations * Measured at the beginning of the year