Download

1 / 60
600 likes | 788 Vues
Learn about the principles and techniques of chromatography, a method to separate components of mixtures using concentration equilibrium differences. This guide covers the chromatogram, performance parameters, instrumentation, preparative and analytical chromatography, and more. Understand the fundamental basis of chromatography, various formats like plate/gel and column chromatography, and the significance of retention time, resolution, peak shape, and efficiency in chromatographic analyses. Discover advanced performance parameters, theoretical plate models, and ways to improve chromatographic efficiency.

E N D
Chromatography • Principles • Techniques
Principles • Introduction • The Chromatogram • Performance parameters • Instrumentation
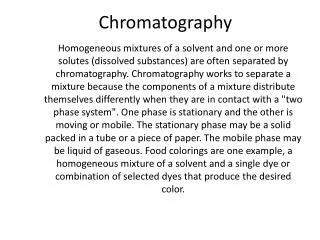
Introduction • Chromatography: The separation of components of a mixture using differences in concentration equilibrium between two phases; one stationary, and one mobile. • Technique is >100years old, optical detection>60years….developments include miniaturisation, increased sensitivity, computer control and collection • Chromatography instrumentation represents more than half the world-wide sales of analytical equipment and materials. • Preparative Chromatography: Separation of components of a mixture and collection of isolated components • Analytical chromatography: Observation, quantification and potential identification of different components using chromatographic techniques
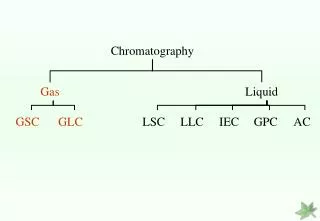
Introduction (2) Fundamental Basis Movement of a compound through the system is governed by the equilibrium process: K Compound (stationary) Compound (mobile) (CS) (CM) Nernst distribution coefficient K = CS / CM i.e. rate/distance of movement is governed by compounds’ relative affinity for stationary or mobile phases Formats A) Plate/gel (e.g. thin-layer chromatography, gel electrophoresis B) Column (e.g. HPLC, GC)
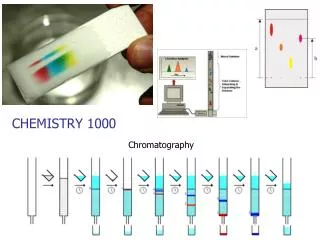
Line of solvent front Developing tank A B A&B A B A&B Coated Plate Solvent Sample Introduction (3): Plates/Gels Consists of using a solvent (mobile phase) sometimes in an applied field to move compounds over a flat surface coated with a suitable stationary phase 1) Sample is loaded in solution 2) Chromatograph is run(developed) 3) Spots are identified/analysed 1) Loaded plate 2) Developing plate 3) Developed Plate Results: Intensity of spot (quantitative) & Retention factor (qualitative)
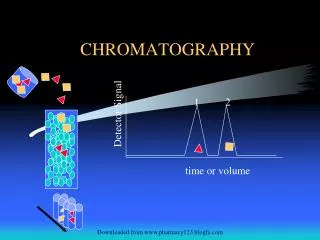
Introduction (4): Columns How does it work? (a) Mixed sample is loaded (b) Elution begins (c) B travels faster than A - separation occurs (d) B is eluted (e) A is eluted A and B are separated and either: • analysed “on-line” with a detector • Collected for further analysis Results: Area under peaks (quantitative) & Retention time (qualitative)
The Chromatogram The output of a chromatograph, continuous trace of amount of analyte (y-axis) against time (x-axis) But what does this tell us? 1) Retention Time: tRQualitative data – what is present? 2) Area under peak: Quantitative data - How much analyte is present? tR tR’ t 0 Analyte peak Peak of unretained Detector Repsonse solute “solvent peak” w ½ Start Time w b
Performance parameters (basic) 1) Resolution Peaks should start and finish at the baseline NOT Well resolved peaks Unresolved peaks 2) Peak shape Peaks should be: • Symmetrical NOT • Representative of a Gaussian distribution • As narrow as possible • Reproducible between “runs”
Performance parameters (basic) Poor peak shape and resolution means failed chromatography due to: • Unstable conditions • Column damage or wear • Column overload (too much analyte) • Air in the system (gives artifactual peaks) • Interfering matrix • Incomplete separation of compounds due to sub optimal conditions • Temperature • mobile phase • stationary phase More on improving performance later but remember for now: RESOLUTION AND RETENTION TIME
Performance parameters (Advanced) Theoretical Plate Model Mathematical performance assessment Based on a series of “snapshots” to mimic continuous behaviour Retention time of analyte: tR = tS + tM where • tS is the time spent in the stationary phase and rate of movement = 0 • tM is the time spent in the mobile phase, rate of movement = mobile phase rate Each molecule has a chance of being mobile or stationary during any “snapshot” Distance travelled between periods in the stationary phase = one theoretical plate Assumes no diffusion in the mobile phase This gives us simple equations describing chromatographic performance
Performance parameters (Advanced) Chromatographic Efficiency Column Efficiency (measured by plate number: N) N = (tR/s)2 tR is total retention time, and s is the standard deviation of a gaussian peak BUT s requires accurate determination of points of inflection, so we use N= 5.54 x (tR / peak width at 50% height)2 Large N indicates good column performance (should be ~10,000 for HPLC) N is increased by: • increased temperature, column length • decreased stationary phase particle size, flow rate, mobile phase viscosity
Performance parameters (Advanced) Chromatographic Efficiency Other variants of chromatographic efficiency Effective N (Neff): If tR is low, then t0 affects apparent efficiency Neff = 5.54 x [(tR - t0) / peak width at half height]2 Plate Height (H): Used to compare columns of different lengths: H= L / N L = column length, N = number of plates H is a measure of plate size, the smaller (lower H) the better (HPLC ~ 10mm) Effective plate height: takes account of columns with different dead spaces Heff = L / Neff Reduced plate height: allows comparison of columns with different particle sizes h = H / dp where dP is the particle diameter (same units as L); (Good HPLC column: h = 3)
Performance parameters (Advanced) Capacity Factor (k) The ratio of mass in the stationary phase (mS) to that in the mobile phase (mM) where total mass: mT = mM + mS Capacity Factor: k = mS / mM = K. (VS / VM) where K is the equilibrium constant, VS is the volume of the stationary phase, and VM is the volume of the mobile phase (dead volume). Determining k Assume VR : VM = mT : mM Then: VR / VM = mT / mM = (mM + mS) / mM = 1 + k So: VR = VM (1 + k) And: tR = tM (1 + k) Since tM = t0k = (tR - t0) / t0 K should be between 1 and 5
Performance parameters (Advanced) Selectivity (α) and Resolution (Rs) Selectivity Factor (α):Comparison of interaction with stationary phase Ratio of capacity factors α = k (B) / k (A) • Primarily affected by changing the stationary or mobile phases • Larger α means better separation (but little gain in resolution beyond α=3) Resolution (RS):A measure of how well separated two peaks are: RS = 2(tR peak A - tR peak B) / (wA + wB) Since measuring w is difficult, can use: RS = 0.25 x [(α - 1) / α] x [ k(B) / (1 + k(B)) x N where B is the last eluting peak, and N is the plate number for B High Rs is better: should be at least 1.5 for baseline separation
Performance parameters (Optimisation) Optimisation depends on type of chromatography, usually involves changes in: • Stationary Phase: Hundreds of kinds on offer, choice based on analytes to be separated, cost Differences based on chemical structure, particle size, column bore and length, compressibility of packing • Mobile Phase:Use changes in polarity, pH, viscosity • Detector:Use best sensitivity available for analytes • Flow rate:affects retention time and diffusion and thus performance • Amount of sample:Too much will overload the column, too little will be difficult to detect accurately • Sample Matrix: Avoid incompatible contaminants, use minimum injection volume, preferable similar to the mobile phase (HPLC) • Temperature: increases improve performance (must avoid decomposition of sample) by increasing solubility and reducing viscosity. Very important in GC.
Performance parameters (Summary) Chromatographic systems must be optimised to give: • Good Peak Shape • Good separation/resolution (N, k, α, Rs) • Flat and horizontal baseline • No “artifactual” peaks • Shortest possible analysis times Resolution and Retention time are key
Instrumentation (1) Origins • Preparative column chromatography (Glass columns) • Internal diameter: 1 - 5 cm • Length: 50 - 500cm • Particle size: 150-200mm (large) • Flow rate: tenths of ml/min, under gravity • N<100/m Developments • Automation • Many different types (see later) • Engineered columns – can takes extreme pressure and temperature • Reduction in column size (Typical Liquid Chromatography: Internal diameter: 4 -10mm, Length: 10 - 30cm, Particle size: 5 -10µm) • N>10,000/m
Instrumentation (3) 1) Gas and Solvent Reservoirs: Contain mobile phase There may be more than one reservoir • Isocratic elution uses a constant mobile phase composition (only one reservoir necessary) • Gradient elution uses more than one, two pumps and a mixing system deliver a mobile phase that varies with time Mobile phase may need pretreatment: e.g. • Filtering: Prior to placing in the solvent reservoirs, or using an in-line filter • Sparging (degassing): bysonication or by bubbling an inert gas (e.g. Helium) through the solvent • Guard Column (positioned after injection port): Provides filtration and preconditioning to protect the column 2) Pumping systems (not Gas chromatography) • Generate high pressures (up to 6000psi) • Generate variable flow rates (0.1 - 800ml/min) • Accurate and reproducible rates, independent of column back-pressure • Be “pulse-free” • Corrosion resistant
Instrumentation (4) 3) Sample addition facility (injection port) • Sampling Loop (see Skoog for diagram) • Syringe injection, through a septum (<1500psi) • Stop-flow, direct injection onto top of column packing • Pump (larger volumes) 4) Column (& oven)- See later for stationary phases by type • Usually stainless steel (may be glass) • Length: 10 - 30cm, up to several m for GC • i.d (internal diameter) mm-cm • Particle size of packing 5 or 10μm • >10,000 plates/m • Most common packing is silica based, may also have alumina, zirconium, polymeric, ion-exchange resin • Short columns are quicker to use but have lower N • Small particle size gives higher N but needs higher pressure to maintain flow • A column oven or a water jacket may be used to provide a stable temperature or to allow chromatography at different temperatures
Instrumentation (5) 5) Detectors (More detail later) • Generally the most expensive part of the instrument • Choice depends on analyte properties, and required sensitivity (and money available) • Performance is measured in terms of Mass Limit of Detection (LOD) which is the mass that gives a signal 5 times the standard deviation of the noise, using 10ml of a sample of Mr =200 6) Output • Chart recorder: contains a drive-mounted pen that moves according to the current supplied by the detector output. May include a second pen, driven by an integrator which “draws” the cumulative signal over time, giving the area under a peak • Integral processor: uses instrument hardware and drop-down menus to allow modifications of conditions, and or inspection/reprocessing of chromatograms • PC - based: output and controls are driven by specialist software written for use on a PC Can allow the spectrum to be reprocessed and reprinted
Instrumentation (6) Automatic Integration and Reprocessing – treat with Caution Automatic processing parameters must be set so that the instrument can “recognise” peaks correctly This includes setting how the instrument recognises: • Baseline • Peak Start and Finish (time) • Non retained peak (to ignore) • Detectivity (size of baseline fluctuation to ignore) This can be altered after a run to improve peak recognition – but will NOT improve poor chromatographic performance
Techniques • Gas Chromatography • Liquid Chromatography • Supercritical Fluid Chromatography • Advanced Techniques
Gas Chromatography From Harris, Quantitative Chemical Analysis, 6e, Chapter 24
Gas Chromatography • Principles • Stationary phase types • Detection Systems
GC Principles • Requires volatile analytes • Utilises gas/liquid partition • Most volatile / lowest boiling point normally elutes first • Resolution primarily influenced by a) Temperature (can have gradient) b) Flow rate (affects diffusion and interaction with stationary phase) c) Stationary phase (type and distribution) d) Column dimensions
GC Stationary phase types (1) Formats include WCOT (wall coated Open tube), SCOT (support coated) and PLOT (porous-layer) From Harris, Quantitative Chemical Analysis, 6e, Chapter 24
GC Stationary phase types (2) Chemistry of Stationary Phase • Chemically bonded (as opposed to coated) are the most stable. • Less polar polysiloxanes functionalised with methyl, phenyl, trifluoropropyl are common. • Polar phases include polyethylene glycols (less thermally stable) Mobile phase: Hydrogen (best), helium or nitrogen – very little scope for optimisation by mobile phase change From Harris, Quantitative Chemical Analysis, 6e, Chapter 24
GC Detection Systems (1) More than 10 types available, 4 most common are: a) Flame ionisation detector (FID) • Eluent burnt in a hydrogen fuelled flame • Leads to release of electrons, dependant on [C] • Requires own thermostat at T>column oven Advantages: Robust, sensitive, semi-universal (C only), wide linear range Disadvantages: Non-selective, destructive b) Thermal ionisation detector (or nitrogen detector) • Similar to FID • Additional alkali metal salt (often rubidium chloride) component Advantages: More sensitive than FID, Selective for N or P, wide linear range Disadvantages: needs frequent renewal and careful calibration, destructive
GC Detection Systems (2) c) Electron Capture detector • Senses reduction in standing current • Normally operated at 300ºC Advantages: Extremely sensitive, Selective for halogens, nitro groups, peroxides, quinones, non-destructive Disadvantages: Radioactive, limited range, easily contaminated d) Mass selective detector • Use mass spectrometry (EI or CI) • Focus on monitoring specific molecular ions quantitatively, although simple spectra are also possible Advantages: Extremely sensitive, and selective by mass Disadvantages: most easily interfaced with a low flow rate system
Liquid Chromatography • Stationary phase types • Adsorption Chromatography • Size Exclusion Chromatography • Capillary Electrophoresis • Ion Exchange Chromatography • Detection Systems
Liquid Chromatography From Harris, Quantitative Chemical Analysis, 6e, Chapter 25
Increasing Polarity Water-insoluble Water-soluble Nonpolar Ionic Non-ionic, polar Partition 102 (Reversed Phase) Adsorption (Normal) Ion-exchange 103 Molecular weight 104 SizeExclusion 105 (Gel permeation) (Gel filtration) 106 Liquid ChromatographyWhich technique to use?
Adsorption/Partition Chromatography • Normal Phase • Reversed Phase
Adsorption/Partition Chromatography Choosing mobile and stationary phases • Stationary phase must have a similar polarity to the analyte • Mobile phase is of substantially different polarity Polarity Series In general, polarity of organic compound in increasing order is: Alkyl < alkenyl < aromatic < halides < sulfides < ethers < nitro < esters ~ aldehydes ~ ketones < alcohols ~ amines < sulphones < sulphoxides < amides < carboxylicacids < phosphates < water Bold means that these groups can also be substantially affected by pH changes NB Avoid conditions that could decompose the analyte
Normal Phase Stationary phase: • normally a solid • Analyte adsorbs to the stationary phase • Packing is usually Silica or Alumina and is therefore polar Mobile phase: • normally organic (i.e. not aqueous) • wide choice of mobile phase Retention: • TR increases with polarity of analyte • Increasing the polarity of the mobile phase reduces elution time • Optimisation normally consists of varying the mobile phase R=OH, CN, NH2 & more
Reversed Phase Stationary phase: • normally a liquid • Analyte dissolves in the stationary phase • Packing is usually modified Silica or Alumina Mobile phase: • normally aqueous, plus MeOH orMeCN • wide choice of mobile phase buffers Retention: • TR decreases with polarity of analyte • Increasing the polarity of the mobile phase increases elution time • Optimisation normally consists of varying the mobile phase R= C18, C8, Ph& more
Size Exclusion Chromatography (1) Separates molecules with a high molecular weight. on the basis of size • Packing consists of small (~10mm) porous particles made of silica or a polymer • Separation is dependent on selective penetration of analytes into pores (requires at least 10% difference in molecular weight) Theory Total column volume Vt = Vg + Vi + V0 , where Vg is the volume occupied by the packing Vi is the volume of solvent in the pores, and V0 is the free solvent volume (similar to injection volume)
Size Exclusion Chromatography (2) Analytes may: 1) be too large to enter the pores at all, and elute at V0 2) enter the pores completely, and elute at V0 + Vi 3) partially (extent determined by K) interact with the pores and elute at V0 + Kvi Exclusion limit: the molecular weight beyond which no interaction with the pores is possible. All analytes beyond exclusion limit elute together at V0* Permeation limit: the molecular weight below which complete penetration of the pores occurs. All analytes below permeation limit elute together at (V0 + Vi)* Selective permeation region: size between permeation limit and exclusion limit, where 0<K<1 Elution volume dependent on K* *Assumption: no other interactions taking place
Size Exclusion Chromatography (3) Applications 1) Simple separations: e.g. a large protein from low Mw contaminants such as amino acids and salts 2) Separation of oligomers: e.g. Series of fatty acids of increasing size 3) Separation of homologs: e.g. sugars in fruit juice 4) Determination of molecular weight: e.g. of a polymer with behaviour calibrated for the conditions used Advantages • Short analysis time • Well defined separation times • Narrow bands and good sensitivity • Few problems with column contamination or sample loss Disadvantages • Limited number of peaks • Requires ~10% difference in molecular weight
Capillary Electrophoresis Separation of analyte ions via differential migration in an electric field, coupled with electro-osmotic flow of mobile phase Advantages • Only needs nL sample • High speed and resolution, virtually no band broadening Instrumentation • Capillary tube (10 - 100mM internal diam., 40-100cm long) • Two buffer reservoirs, with platinum electrodes • DC potential (20-30 kV) applied along capillary • Sample introduced one end, detector at other • Direct of potential depends on charge (+/-) of analyte
Capillary Electrophoresis Mobile Phase • Commonly phosphate or borate buffer (20-100 mM) • pH and Ionic strength must be controlled • Can add detergents to transport neutral molecules in a micelle (MEKC) Stationary Phase • No stationary phase for true CE • Newer developments introducing a stationary phase combine CE and HPLC to give electrochromatography Principles of separation Based on interaction of analyte with electric field Migration velocity v = (µe + µeo) E where µeand µeoare the electrophoretic mobilities of the analyte and buffer, and E is the applied field strength
Capillary Electrophoresis Retention and Resolution: dependent on • Charge / size ratio is primary separation factor • Charge gives v and thus RT • Size gives v and thus RT • Interaction with buffer ions / molecules • pH and ionic strength of buffer affects ionisation of analyte – and thus RT • Applied field • Column Length • Diffusion Optimisation: may involve • bufferpH - alter charge status of analyte • buffer ionic strength - change capacity to produce electro-osmotic flow • organic modifiers: influence ionic strength, and can “capture” analytes selectively to affect charge/size ratio
Capillary Electrophoresis Detection: normally similar to LC detectors but • Peak area is dependent on rate of movement through the detector • Peak area not independent of retention time • Mostly “on-column”, i.e. capillary forms flow cell • Short path length gives reduced sensitivity • Indirect methods may be needed to increase sensitivity Applications There are a variety of named techniques, each suitable for different analytical problems. You may see mentioned: • Capillary zone electrophoresis • Capillary gel electrophoresis • Capillary isotachophoresis • Capillary isoelectric focusing • Capillary electrochromatography • Micellar electrokinetic capillary chromatography
Ion Exchange Chromatography Uses displacement of an ion from the stationary phase by a solute ion K is dependent on relative affinity of the analyte for the surface over the solvent ions Principles • Small K means low affinity – so low RT • K is often quoted vs. a common reference ion (e.g. H+) • K affected by: • Charge of ion: charge gives K • Size of hydrated ion
Cation Exchange Chromatography Use organic acid functional groups as ionic species “Strong acid” type uses sulphonic acid (RSO3H) (more common) “Weak acid” type use carboxylic acids (RCOOH) xRSO3H + Mx+ (RSO3-)xMx+ + xH+ Stationary Mobile Stationary Mobile Ion Series For a strong acid column, (e.g. RSO3H) size of K : Ag+ > Cs+ > Rb+ > K+ > NH4+ > Na+ > H+ > Li+ and Ba2+ > Pb2+ > Sr2+ > Ca2+ > Ni2+ > Cd2+ > Cu2+ > Co2+ > Zn2+ > Mg2+
Anion Exchange Chromatography Use amine groups as ionic species “Strong base” type uses quaternary amines (e.g. RN(CH3)3+OH-) “Weak base” type uses secondary or tertiary amines xRN(CH3)3+OH- + Ax- (RN(CH3)3)x+Ax- + xOH- Stationary Mobile Stationary Mobile Ion Series For a strong base column, affinity series for K is usually : SO42- > Cr2O42- > I- > NO3- > Br - > Cl- > HCO2- > CH3CO2- > OH- > F-