Download
1 / 40
400 likes | 420 Vues
Conduct simulation experiments to evaluate the impact of new instruments, data assimilation, and forecast analysis on weather predictions.

E N D
Global Observing Systems Simulation Experiments at NCEP Michiko Masutani http://www.emc.noaa.gov/research/osse
Authors and Contributors 1NOAA/NWS/NCEP/EMC, Camp Springs, MD 2NOAA/NESDIS, Camp Springs, MD 3Simpson Weather Associates, Charlottesville, VA 4Joint Center for Satellite Data Assimilation 5NASA/GSFC, Greenbelt, MD #RS Information Systems +Science Applications International Corporation %QSS Group, Inc. OSSEs: Observing Systems Simulation Experiments Michiko Masutani 1#, John S. Woollen 1 +, Zoltan Toth1, G. David Emmitt3, John LeMarshal4, Stephen J. Lord1, Russ Treadon1, Thomas J. Kleespies2 , Haibing Sun2 %, Yucheng Song 1+, Sidney A. Wood 3 , Steven Greco 3, Chris O’Handley3, Joseph Terry 5, Weiyu Yang 1+, John C. Derber1,Paul VanDelst1+, Bert Katz1+ Many other people of EMC, SWA, NESDIS, NASA/GSFC, JCSDA, and ECMWF
Real Nature Run Simulation Simulation of data Withdraw or Add data for existing instruments Experimental data Real observed data Control data + Simulated data for future instruments Control data Real observed data Simulated data Simulated data Calibration Evaluation of New Instruments Data assimilation Data assimilation Data assimilation Analysis Analysis Analysis Analysis Analysis Analysis impact test Analysis impact test Nature Run Forecast impact test Forecast Forecast impact test Forecast Forecast Forecast Forecast Simulated analysis and forecast are also evaluate against the Nature Run Analysis and forecast are evaluate against analysis of control
Two OSSEs NCEP NASA/GLA • Winter time Nature run (1 month) • NR by ECMWF model T213 (~0.5 deg) • NCEP data assimilation T62 ~ 2.5 deg • 1993 data distribution • Simulate and assimilate satellite 1B radiance • Use line-of- sight wind for DWL • Evaluation and adjustment of cloud • Calibration performed • Effects of observational error tested • Scale decomposition of anomaly correlation skill • Summer time Nature run (4 month) including hurricanes. • NR by NASA FVCCM model with 0.5 deg • Use NASA DAO GEOS-3 data assimilation with 1-1.5 deg • 1999 data distribution • Use interpolated temperature for radiance data • Use U and V wind for DWL data • Impact on hurricane forecast • Evaluate cyclone tracks and Jet streak locations
The realistic cloud cover of NR is important. However, three observations are very different.
Underestimation of Low level stratocumulus over ocean. Over estimation of low level cloud over snow were evident. Adjustment based on ground based observation was performed.
OSSE Calibration • Compare real data sensitivity to sensitivity with simulated data • Relative order of impacts should be same for the same instruments • Magnitudes need not be the same but should be proportional • Quality control (rejection statistics) • Error characteristics (fits of background to Obs) • Data impact depends on • Data assimilation (DA) system • Choice of the nature run. • Observational error assignment.
Feb.5 Feb.13 March 7 Real Atmosphere (unknown) Real analysis with OP99 Observation (unknown observational error) Initial condition from reanalysis with OP93 OSE (real data) Control experiment Provide initial condition Spin up period Add or subtract data Nature Run (known) Spin up period Simulation of observation Known observational error Provide initial condition Control experiment OSSEs Add or subtract data Switch to OP2005 model on Feb 5th
Compare real data sensitivity to sensitivity with simulated data Impact of withdrawing RAOB winds Real Simulated Analysis 72 hour forecast OSSE Calibration 500hPa U
NH SH Calibration of Simulated Data Impacts Vs Real 500 hPa Height Anomaly Correlation 72 hour forecasts
SST and Impact of TOVS Anomalous warm localized SST in SH Pacific in REAL SST. In simulation experiment constant SST is used. Four analyses are performed with real SST, constant SST, with and w/o TOVS. With TOVS data the difference is small in mid troposphere but without TOVS data, large differences appear and propagate. Four experiments are repeated for simulated data. This atmospheric response to SST is reproduced by simulated experiments. Impact of TOVS is much stronger in real atmosphere. With variable SST TOVS radiance become much more important.
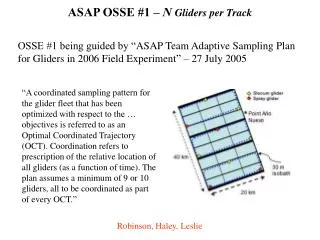
Bracketing experiments were performed The real DWL will be somewhere among these. All levels (Best-DWL): Ultimate DWL that provides full tropospheric LOS soundings, clouds permitting. DWL-Upper: An instrument that provides mid and upper tropospheric winds only down to the levels of significant cloud coverage. DWL-PBL: An instrument that provides only wind observations from clouds and the PBL. Non-Scan DWL : A non-scanning instrument that provides full tropospheric LOS soundings, clouds permitting, along a single line that parallels the ground track. Impact Assessment of a DWL using OSSEs
All levels (Best-DWL DWL-PBL DWL-Upper: Non-Scan DWL Results from OSSEs for Doppler Wind Lidar (DWL) Number of DWL LOS Winds 2/12/93 All levels (Best-DWL): Ultimate DWL that provides full tropospheric LOS soundings, clouds permitting. DWL-Upper: An instrument that provides mid and upper tropospheric winds only down to the levels of significant cloud coverage. DWL-PBL: An instrument that provides only wind observations from clouds and the PBL. Non-Scan DWL : A non-scanning instrument that provides full tropospheric LOS soundings, clouds permitting, along a single line that parallels the ground track.
Non scan Clustered-Sample Clustered-Sample Distributed Sample Distributed Sample Note: In order to measure U and V from non scan DWL, two satellite or DWL sample for two directions are required
Scanning significantly increases the impact • In NH, DWL with scanning is required to produce significant additional skill over existing data. • Non-scan DWL may produce significant impacts in SH similar to 1993 radiance data. Highlight of the Results from DWL OSSEs
Forecast hours The diagram is anomaly correlations with nature run for 200mb V.Improvement in forecast skill with respect to forecasts with RAOB and surface data only. Skill for Northern Hemisphere synoptic scale events are presented. The resolution of DA is T62.x NH synoptic scale Using 1999 version of NCEP DA DWL with scan: 12 hour improvement DWL non scan: 4 hour improvement %
Other finding through DWL OSSEs • Upper level data become more important after 3 days even at lower levels • Impact of DWL is more significant at smaller scales • In tropics large analysis impacts diminish rapidly • Need more model improvement to achieve forecast impact • DWL will be useful in evaluating analysis • Systematic large scale error added to the simulated data increase the data impact at large scale • There are evidence that even non-scan lidar will produce an almost similar amount of impact as RAOB wind in NH average. • RAOB wind has more impact over land. Non-scan lidar has more impact over ocean and tropics. • Scanning is more important in upper troposphere than in lower troposphere
Scan Lidar Doppler Wind Lidar (DWL) Impactin Synoptic Scale 8 Non Scan 8 Time averaged anomaly correlations between forecast and NR for meridional wind (V) fields at 200 hPa and 850 hPa. Anomaly correlation are computed for zonal wave number from 10 to 20 components. Differences from anomaly correlation for the control run (conventional data only) are plotted. Upper lidar become more important in low level Forecast hour
Percent improvement over Control Forecast (without DWL) • Open circles: RAOBs simulated with systematic representation error • Closed circles: RAOBs simulated with random error • Orange: Best DWL • Purple: Non- Scan DWL Effect of Observational Error on DWL Impact Wave 10-20 Total DWL with large scale error Significant impact in large scale by adding systematic large scale observational error Forecast length
T170 T62 Analysis T170 T62 48 hr -5 -2 -1 0 1 2 5 Impact of DWL with Scanning T170 vs. T62 NOAA 11, 12 TOVS were not ready for T170 experiments
Differences in anomaly correlation Total scale Synoptic Scale T62 and T170 CTL (Conventional data only) 200 mb V T62 CTLwith Non Scan DWL -T62 CTL -T62 CTL T170 CTL with Non Scan DWL -T170 CTL -T170 CTL Data Impact in T62 vs. T170 T62 T170 T62 CTL with Scan DWL T170 CTL with Scan DWL ◊ CTL ● Non-ScanDWL X Scan DWL Impact with T170 model look less than with T62 model
Differences in anomaly correlation Synoptic Scale Total scale T62 CTL (refernece) (Conventional data only) 200 mb V - CTL - CTL T170 CTL - CTL ◊ CTL X CTL+Scan DWL Data Impact of scan DWL vs. T170 Impact of T170 model Impact of DWL T62 CTL with Scan DWL T170 CTL with Scan DWL Adding DWL with scan is more important than T170 model T170 is better than adding DWL with scan
Impact of DWL T170 vs. T62 (Cont) Apparent data impact is less in a high resolution model (T170 or better model) because the guess is already good. However, improvement from the new data becomes more robust in high resolution model. Much of the apparent improvement in a low resolution model diminishes in the forecast fields.
Non-scan Lidar over CTL Non-scan Lidar vs. RAOB Wind CTL: Conventional Data no Satellite data Analysis 48 hr -5 -2 -1 0 1 2 Red: DWL has more impact Blue: RAOB Wind has more impact Red: DWL has positive impact Blue: DWL has negative impact Non-Scan Lidar vs. RAOB WindT170 (Feb13- Feb20) Non scan lidar has more impact over ocean and RAOB has mode impact over land Impact increase in forecast fields Non scan lidar showed minimum impact over RAOB wind 5
Non-Scan Lidar vs. RAOB Wind Non scan lidar showed minimum impact over RAOB wind Non scan lidar has more impact over ocean and RAOB has mode impact over land Impact increase in forecast fields
On going work and plans • Targeted DWL for NPOESS • Including CMV • CMV with estimated error • CMV enhanced by DWL • AQUA data • With and without cloud to test QC • Combined impact with DWL • Participating development of DA system for new instruments • Test and find out various potential problems.
OSSE with TOVS and AIRS • December 2003 version of NCEP DA system : • AIRS showed minimum impact. • Very little data were assimilated. • NOAA 11, 12 data ( available in 1993 and can be used for calibration) • Prepared for new 2005 version of DAS and tested. • Need some tuning • Progress: • Updated simulation and assimilation code. • AQUA data has been produced with and without cloud condition to allow to test new QC. • CrIS and ATMS have been simulated • Need to develop DA system • NESDIS is working on simulation of CMIS
Adaptive Targeting Missionfor NPOESS Hybrid DWL • Coherent detection sub-system (wedge scanner or HOE) • 100% duty cycle • Lower tropospheric and enhanced aerosol/cloud winds • CMV height assignment • Reduce DAS observation error by ~2-3 m/s (per Chris Velden) • Depth of PBL • ICAT for direct detection + target identification by LEKF (e.g.) • Direct detection (molecular) sub-system (HOE) • 10-15% duty cycle (aperiodic, i.e. adaptively targeted) • Cloud free mid-upper tropospheric/ lower stratospheric winds
Experiments for Thinned Hybrid DWL Testing 10% use of Upper level DWL • 100 %PBL • 100%PBL+ 100% Upper • 100%PBL +10% Upper (10min on 90 min off) • 100%PBL+ 50%Upper also tested Experiments with and without NOAA 11,12 radiance data • Quick look of impact in analysis for low resolution (T62) experiments showed that impact of Upper DWL is proportional to amount of data included. • 10% upper: 20% impact • 50% upper: 80% impact
Targeted Hybrid DWL (10% of upper DWL) Proposed strategies for targeting • Random selection. Uniformly choose 10% • Select the area of target based on (obs-ges) • Select area based on interest • Avoid area which does not produce much impact. (Example: Cloudy area) • Further evaluation to be performed • higher resolution model (T170) • forecast experiments (up to 72hr) • More discussion on evaluation strategies will be continued
DIRECT LINK BETWEEN NOAA THORPEX SCIENCE AND IMPLEMENTATION PLAN (NTSIP) ANDTHORPEX INTERNATIONAL SCIENCE PLAN & THORPEX IMPLEMENTATION PLAN (TIP) TIP TIP – “OBSERVING SYSTEM” GEOSS TIP – “DATA ASSIMILATION…” OSSE is recognized as a major cross cutting activity. NTSIP THORPEX SYSTEM CROSS-CUTTING ACTIVITIES THORPEX GLOBAL ENSEMBLE (TIGGE) TIP – “SOCIAL & ECONOMIC APPLICATIONS” TIP – “PREDICTABILITY & DYNAMICAL PROCESSES”
Joint Center for Satellite Data Assimilation (JCSDA) MissionAccelerate and improve the quantitative use of research and operational satellite data in weather and climate analysis and prediction models The Role of JCSDA in OSSEs • As a result a key program element for the Center is to conduct OSSEs for advanced satellite sensors to be used for weather and climate (environmental ) analysis and prediction. • Instruments being currently assessed for such experiments are the CrIS, ATMS, GOES-R/GIFTS and the HyMS* – P and G%. * HyMS Hyperspectral Microwave Sounder % P- Polar, G Geostationary
ECMWF will be able to provide a Nature run. The detail need to be defined. Data would be made available via existing MARS service. Possible other candidate: Earth Simulator, fv GCM from NASA Search for the New Nature Run Preparation of the nature run consume significant resources. One or two good nature runs for many OSSEs Current plans are:-one 13-month long run at T511L91 with detailed output every 3h-for selected periods of the previous one (few weeks duration, totalingtwo months): T799L91 run with output every 30 minutes
Select two or three most interesting periods Get initial condition from L-NR Regional NR with high temporal and high horizontal resolution T799L91 30 min dump New Nature Run (ECMWF proposal) Low resolution Nature Run (L-NR) One year (13month) low resolution (T511) with more vertical levels in stratosphere. 91 levels and 3 hourly dump. Remove the drift. (Discard the first month) Daily SST and ICE (Provided by NCEP) High temporal resolution NR T511L91 30 min dump High horizontal resolution NR T799, 91 levels 3 hourly dump Archived in MARS system Need more discussion and consider various interests
Extended international collaboration within Meteorological community is essential for timely and reliable OSSEs • Operational Test Center OTC – Joint THORPEX/JCSDA • JCSDA (NCEP, NESDIS,NASA), ESA, EUMETSAT • THORPEX, NPOESS Summary • OSSE is critical tool for : • Designing future observing systems • Improving DA and ensemble systems • Current NCEP system showed OSSEs are capable to provide critical information for assessing observational data impact • Future developments at NCEP will be under JCSDA and coordinated with THORPEX and other international scientific community. • Need new nature run which will be used by many OSSEs.
Challenges in OSSE Research • The concept of OSSE is simple. However, there are many details in achieving a reliable OSSE • Short cuts will degrade OSSE • It is not possible to reproduce the real system perfectly • Evaluate the consequences of a shortcut and present with results • OSSE is a very labour intensive project. • Collaboration is very important • Require many experts in many fields. • Involve all elements of NWP • Small amounts of time from many people needed • There are limitations from the nature run provided • The limitations need to be evaluated • Results keep changing as DA system develops • OSSEs need to be repeated over and over again with different systems in various NWP centres.
Lessons from OSSEs valuation against truth (NR) • OSSE can evaluate data impact against truth (NR) - Negative impact can be evaluated • Many findings are different from (theoretical?) expectation. • Worth trying even if not so perfect. • Coordination is very important. - Missing elements hold back whole project • Interpretation has to be done very carefully • Apparent impact depends on CTL • The different between NR and real atmosphere Difference in Observational errors • Work involved • Check NR • Data simulation • Check the simulated data • Preparation of fix files • Assimilation • Evaluation • Diagnostics • Presentation
Lessons from OSSEs (cont.) • Simulation of observation • Need Orbit simulator • Need to be flexible. Frequent dump of NR and simulate data after ward instead of the time of NR generation. • OSSE with BUFR formatted data • Speed up implementation • Software for the interface • BUFR decoder etc. • Interpolation for the NR • OSSEs are easy to get last priority • Need involvement of operational staffs, who are already overloaded by implementation of existing data • Keep reminding community and instrument community about the benefit of OSSEs in long run.
Observing Systems Simulation Experimentsat NOAA National Centers for Environmental Prediction The current NCEP system has shown that OSSEs can provide critical information for assessing observational data impacts. The results also showed that theoretical naive explanations will not be satisfactory when designing future observing systems. NCEP leads an expanding national and international collaboration in OSSE effort Results from OSSE with a high resolution model Apparent data impact is less in a high resolution model (T170 or better model) because the guess is already good. However, improvement from the new data becomes more robust in high resolution model. Much of the apparent improvement in a low resolution model diminishes in the forecast fields. ECMWF agreed to do the next Nature Run (OSSE ground truth). Proposal:A 13 month T511 run archived every 3 hours & T799 runs archived every 30 minutes for selected periods. Joint Center for Satellite Data Assimilation (JCSDA) recognized OSSE as a key program element. Extended collaboration within the THORPEX community is essential for timely and reliable OSSEs. JCSDA, NCEP, NESDIS,NASA, ECMWF,ESA, EUMETSAT NCEP collaborates with GMAO/GSFC/NASA to study error characteristics in Data Assimilation using OSSE. Impact of a space based Doppler Wind Lidar with scanning on 200hPa V-component fields.
http://www.emc.noaa.gov/research/osse http://www.emc.ncep.noaa.gov/research/osse