Download

1 / 27
290 likes | 643 Vues
Quantitative Analysis of the Ideal Free Distribution . G. Ramirez, G. Huete, T. Knight, K. Heard, and D. Bellinger University of Miami Department of Biology Coral Gables, Florida, USA. Out line. Introduction: Gabriela Huete Methods: Desmond Bellinger Results: Keandre Heard

E N D
Quantitative Analysis of the Ideal Free Distribution G. Ramirez, G. Huete, T. Knight, K. Heard, and D. Bellinger University of Miami Department of Biology Coral Gables, Florida, USA
Outline • Introduction: Gabriela Huete • Methods: Desmond Bellinger • Results: Keandre Heard • Discussion and conclusion: Trenton Knight • Acknowledgments: Gabby Ramirez
INTRODUCTION • Ecologists attempt to establish general behavioral rules of animals. • One of the most well-known generalizations is the Ideal Free Distribution hypothesis (Fretwell and Lucas, 1970). • This ecological term basically refers to the way animals distribute themselves in their natural environment.
Example: 12 turtles are presented 2 groups of food. The food ratio is 3:1.
According to the Ideal Free Distribution, the turtles should distribute themselves in proportion to the food, 9:3.
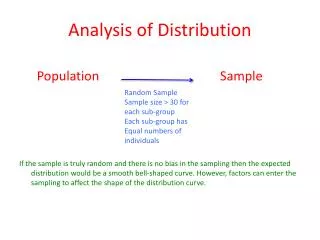
Hypothesis • According to the Ideal Free Distribution, we expected the ratios of turtles at the feeding stations to correspond quantitatively to the proportions of food at the feeding stations. • Therefore, in performing our experiment, we tested the following null hypothesis: Ho: The proportion of turtles at the feeding stations will not significantly correspond to the proportions of food being delivered at the stations.
What we did • In this experiment, we tested Ideal Free Distribution by using the turtles as our experimental species. We fed the turtles at four feeding stations, with ratios of food at 6:3:2:1.
Methods (setting up) • Location: “pond near the bridge” at F.I.U. • Materials: Pond carp food, four spoons different in size (TBS, ½ TBS, TSP, ½ TSP), and a stopwatch. • Teams: teams of two; one thrower and one counter. spread out evenly and assigned a spoon randomly; assigned a person each trial as the time keeper.
Methods cont. (how we did it) • Each experiment lasted 15 minutes. • Food was thrown every 30 seconds and turtles were counted 10 seconds after food was thrown. • A turtle was counted only if it showed interest in the food.
Turtles Peninsula cooter Turtles in front of a feeding station
Methods cont. (data) • The counters would record the number of turtles eating in front the teams. • Using the data, we found the averages, standard deviations, and the long term means. • We also needed to identify the “transient” of the data sets. • We made exactly eight graphs with the 4 data sets.
Results • We took data sets from 4 different trials. • We analyzed data and determined a “transient” and “long term” period for each trial. • We calculated total and long term means for the data sets. • We analyzed data to see if the following inequalities held: Number of turtles for TBS > ½ TBS > TSP > ½ TSP
“Transient Period” “Long term period”
Calculated vs. Theoretical • We are interested in comparing our data to the theoretical ratio 6: 3: 2: 1. • Consider the results from the 2nd trial on 6/25/08 long term data. • Calculated means 32.6: 17.0: 11.4: 7.9. • If we set 6 for ½ TSP, then the theoretical ratios are 36: 18: 12: 6.
Other Trials Not all experiments were completely consistent with the expectations of the Ideal Free Distribution.
To recapitulate… • What we did: several sets of data were gathered to test the hypothesis. • Hypothesis: the ordering of the numbers of turtles should be consistent with the ordering of the sizes of the spoons. That is, since TBS> ½ TBS>TSP> ½TSP, we expect the number of turtles at TBS >the number of turtles at ½ TBS>the number of turtles TSP> the number of turtles at ½ TSP. • Null hypothesis: The number of turtles at a specific feeding station will not significantly correspond to the amount of food being thrown.
Did the experiment reject the null hypothesis? • In data trials 1 and 2 the sequence worked out nicely but in 3 and 4 it did not work out the same because the teaspoon had more turtles than half a tablespoon. • There are many confounding factors that could have affected our test of the Ideal Free Distribution.
Confounding Factors • Food drifted from feeding spot • Interference from ducks and fish • The way food was thrown was not the same for all teams • Difficulty in counting turtles
Conclusions • Conclusion: we rejected the null hypothesis because there were significant differences of numbers of turtles at spoons of different sizes. • Because of all the confounding factors, we didn’t get complete consistency between the observations and what we expected from the ideal free distribution.
Acknowledgments The researchers would like to thank: • Howard Hughes Medical Research Institute and the University of Miami for funding the program • Faculty Mentor Dr. Don DeAngelis • Graduate Facilitator Mr. Brian Coburn • Program Coordinators Dr. Michael Gaines and Dr. Dana Krempels • Our teachers: Ms. Charlyne Strachan and Ms. Marilyn Polokoff
Lastly, we would like to thank our Undergraduate Facilitator, Mr. Joel Tamayo.