Analysis of Quantitative Data
Analysis of Quantitative Data. Descriptive Statistics. Reporting Data. The means by which data is reported is partially driven by the choice of measurement Nominal, ordinal = Lower levels of measurement Interval, ratio = Higher levels of measurement. Reporting Data.


Analysis of Quantitative Data
E N D
Presentation Transcript
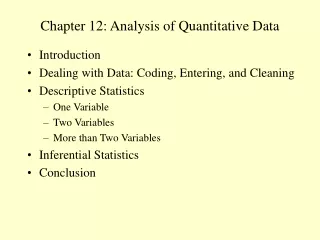
Analysis of Quantitative Data Descriptive Statistics
Reporting Data • The means by which data is reported is partially driven by the choice of measurement • Nominal, ordinal = Lower levels of measurement • Interval, ratio = Higher levels of measurement
Reporting Data • Fewer data analyses are appropriate for lower levels of measurement • Higher levels of measurement can be analyzed using all statistical techniques
Rules of Thumb Data Analyses • Always report the total number of cases in each table • Avoid computing proportion, percentages for <50 cases.*
Descriptive Techniques • Frequency distribution • A tally of the raw number of responses falling into each category • Represents a one-to-one match between response category and distribution of responses • Ordinal categories are treated as independent units
Reporting Frequency Distributions • Present the initial frequency distribution (one-to-one match) • Re-categorize data as necessary to present different ‘angles’ of the data
Descriptive Techniques • Proportions • The frequency of responses relative to the total • Total response proportion = 1.0 • Percentages • Proportion multiplied by a quotient of 100
Descriptive Techniques • Ratios • Used when the relationship between objects is important • X ‘in relation to’ Y • Example: “The representation of males to female respondents was 3 to 1….”
Data Analyses Specific to Interval, Ratio Data • Interval and ratio data can be analyzed using all of the aforementioned techniques • In addition, such data can be analyzed using measures of central tendency
Measures of Central Tendency • Mean • Provides a summary of the data average • Assumes a normal (representative) distribution of the scores • Often accompanied by a variance, and standard deviation
Measures of Central Tendency • Median • The middle value of a data set • Assumes an equal distribution of scores above and below the mid-point • Mode • The most frequently-observed value in a data set