Download
1 / 20
200 likes | 309 Vues
The Utility of Considering Dual-Pol Radar Signatures in the Tornado Warning Process. Michael L. Jurewicz, Sr. and Christopher Gitro Noaa/nws, binghamton, ny Northeast regional operational workshop 10 december 2013. Outline. Motivation Previous Research Methodology / Latest Results

E N D
The Utility of Considering Dual-Pol Radar Signatures in the Tornado Warning Process Michael L. Jurewicz, Sr. and Christopher Gitro Noaa/nws, binghamton, ny Northeast regional operational workshop 10 december 2013
Outline Motivation Previous Research Methodology / Latest Results Summary / Conclusions Future Work
* Tabulated for the WFO’s in our study (ALY, BGM, BOX, BTV, BUF, CAR, CTP, GYX, OKX, PBZ, and PHI) * Total of 62 events for these offices; with 27 of them fully warned and 8 partially warned; for a POD = 0.5 (well below expected performance standards) * FAR stats (0.79) were similarly below established goals NWS ER Tornado Warning Statistics for 2012-2013
Drop Size Sorting / Zdr Arc From Kumjian and Ryzhkov, 2009 From Romine, et. al, 2008 * Enhanced Kdp (blue) gets displaced left of enhanced Zdr (orange) via preferential size sorting * Conceptual schematic of differing hydrometeor descents and Zdr arcing
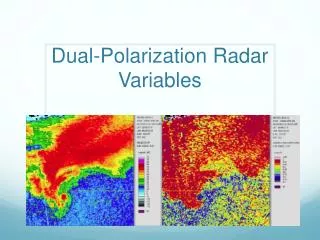
* EF -1 tornado was on the ground at this time (near Trinity, AL) * Note the westward displacement of Kdp maxima (lower right) versus Zdr maxima (lower left) * Also, note the arc-shaped configuration of the Zdr pattern (lower left) ZH SRV KDP ZDR Radar 4-Panel from Northern Alabama at 1620 UTC, 27 April 2011 (from Crowe, et. al, 2012)
* EF -1 tornado was on the ground at this time (near Trinity, AL) * Note the westward displacement of Kdp maxima (lower right) versus Zdr maxima (lower left) * Also, note the arc-shaped configuration of the Zdr pattern (lower left) ZH SRV KDP ZDR Zdr Max Radar 4-Panel from Northern Alabama at 1620 UTC, 27 April 2011 (from Crowe, et. al, 2012)
Methodology • Favorable initial results (Crowe, et. al, 2012) were further put to the test over the Northeastern U.S. (New England, NY, PA, and NJ) • 30 Storms (17 Non-tornadic and 13 Tornadic) were chosen from the 2012 and 2013 convective seasons, each within a potentially favorable synoptic environment for tornadogenesis: • ML CAPE > 700 J/kg • 0-6 km Shear > 40 kt • 0-1 km Shear > 20 kt • 0-1 km SRH > 100 m2/s2 • Many radar/storm-scale parameters were tabulated at the lowest tilt • Including specific Zdr and Kdp maximum values, and their separation distances (nmi) • AWIPS/GR2 Analyst sampling and distance measuring tools
* EF -1 tornado was on the ground at this time (near Elmira, NY) * Once again, note the westward displacement of Kdp maxima (lower right) versus Zdr maxima (lower left) * Also, note the developing arc-shaped region of enhanced Zdr (lower left) Radar 4-Panel from Central New York at 2010 UTC, 26 July 2012
* EF -1 tornado was on the ground at this time (near Elmira, NY) * Once again, note the westward displacement of Kdp maxima (lower right) versus Zdr maxima (lower left) * Also, note the developing arc-shaped region of enhanced Zdr (lower left) Zdr Maxx Radar 4-Panel from Central New York at 2010 UTC, 26 July 2012
Statistical Correlations • Strongest correlations to tornadic development (either same volume scan or in the near future): • Zdr and Kdp separation (nmi) – 0.50 • Maximum gate-gate shear (kt) – 0.38 • Maximum SRM increase within a volume scan – 0.30 • Existence/development of a Zdr arc – 0.23 • Given approximately 300 data points (radar volume scans), these values are statistically significant to the 99th percentile (Gibbons, 1976)
* All 30 storms in the database represented * Note the typically much larger horizontal separation for tornadic storms (red) * For the non-tornadic storms (blue), little separation was typically seen (data points tightly clustered around the center of the plot) Polar Plot of Kdp maxima (red for tornadic storms and blue for non-tornadic storms) versus Zdr maxima (center point)
* Looking at +/- 3 volume scans from T=0 * T=0 is either the time of initial tornado touchdown or tornado warning issuance (null events) * Note the large differences in separation magnitude between T-2 and T=0 Horizontal Separations (nmi, y-axis) of Zdr and Kdp maxima over time
* Once again, looking at +/- 3 volume scans from T=0 * T=0 is either the time of initial tornado touchdown or tornado warning issuance (null events) * Rotational velocity couplet seems to spike in intensity near T=0 for tornadic storms Trends of Maximum Gate-Gate Shear (kt, y-axis (Storm Relative Motion)) over time
Take Home Points • Horizontal separation of Zdr and Kdp maxima via drop size sorting (enhanced low-level helicity) seemed to be a reliable indicator of tornadogenesis • Matches previous research well over the Southeastern U.S. • Initially promising results perhaps warrants consideration in the tornado warning process • Gate-gate shear values tend to maximize right around the time of touchdown (T=0) in tornadic storms • Although there was a general tendency for Zdr arc formation in Northeast U.S. tornadic storms, drop size sorting appeared to be the more readily apparent phenomenon via radar interrogation
Future Work Publish results Develop methods to make Zdr/Kdp separations easier to recognize in real-time Continue to evaluate these processes in coming convective seasons