Download
1 / 18
180 likes | 324 Vues
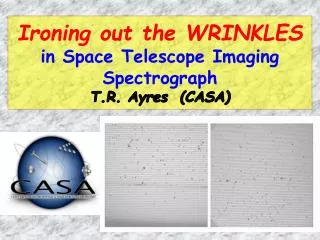
Ironing out the WRINKLES in Space Telescope Imaging Spectrograph T.R. Ayres (CASA) . Warning: this talk deals with lower rungs of J.J. Drake’s Ladder, where, sadly, sexiness is low . But, in fact, nothing on upper rungs of ladder would get done without good instrument calibrations .

E N D
Ironing out the WRINKLES in Space Telescope Imaging SpectrographT.R. Ayres (CASA)
Warning:this talk deals with lower rungs of J.J. Drake’s Ladder, where, sadly, sexiness is low.But, in fact, nothing on upper rungs of ladder would get done without good instrument calibrations. CALIBRATION
WRINKLES Project OBJECTIVE: Test techniques for improving echelle-mode wavelengthscales of STIS, solar-system’s premier high-res UV spectrograph in space (now in tandem with super-high-sensitivity, mod-res COS). METHOD: Measure deep exposures of Pt/Cr-Ne l*cal lamps (“WAVECALs”), processed as if science images; compare with NIST/ECF laboratory wavelengths.
Raw Wavecal Images low-ls low-ls E140H-1234 E230H-1763
WAVECAL Archive • Several hundred l*calsavailable, mainly in primary tilts (darkercolors). Significant overlaps between settings. Many secondary tilts have poor exposure depth (yellow).
Laboratory Ref Wavelengths Excellent lists l< 1800 A (STIS lamp flight spare) from NIST/ST-ECF collaboration (Sansonneti et al. 2004); but key STIS Cal Enhancement extension to longer wavelengths (Kerber et al. 2006) not yet completed. Earlier NIST meas (black IDs) missing Cr I & II (blue prelim IDs); Wallace & Hinkle (2009) KPNO FTS Cr I (red) l > 2360 A.
“Self-Calibration*” template l-meas 11 FUV-H +26 NUV-H *Utilize STIS as its own laboratory spectrometer to enhance ref line list
RESULTS Replacing CALSTIS Xcorr template (below, red curve) has minor effect on H settings (upper left); virtually no effect on M tilts (lower left). However, distortion correction makes factor of ~2 improvement in precision of echelle wavelength scales. (Note: full y-axes are ~2/3 resol each).
Beyond post-facto Correction • Properly orthogonal variables: CALSTIS dispersion polynomial: S= f(m,l), with terms up to fully bi-quadratic ([ml]2), although missing m2 and l2, but including extra term(ml)3(coeffs not pop’d in CalLib, however). l has power in m direction; not properly orthog. k=ml(“grating parameter”) is orthog to m, but bi-quadr poly showed disappointingly little improvement over m,lcombo.
Left panel compares current (‘orig’) CALSTIS dispcoeffs, with newly derived values (‘new’) based on deep l*cals& new line lists, and poly models (k,m) of increasing order: little improvement for n>2. Right panel adding terms to CALSTIS model. Single new term,m2, plus populating coefficients of existing(ml)3, is as effective as full n=2.
Out-of-the-Box Ideas On left sideis map of E230H lamp lines in “super-MAMA” detector coordinates versus intensity (green=high brightness; orange=intermed; open circles= low) ; right side shows residual red/blue shifts after application of global model with terms in detector coordinates and dispersion space. Against all odds, this actually works, with c2 not too much larger than obtained for individual settings. Suggests clear separation between detector properties and dispersion characteristics.
At left: distortions from global modeling persistent in detector coordinates. Distortions (max: +/- 2 km/s) very systematic between modes (M & H) and cameras (FUV & NUV); apparently are fundamental property of the MAMAs. Quadrupolar geometrical distortions are unlike “pincushion” and “barrel”of typical optical systems.
Conclusions • STIS is a way excellent instrument, but capable of significantly better wavelength performance than delivered by current dispersion models embedded in CALSTIS(although, to be sure, the present precision well exceeds pre-flight specs). • Pipeline dispersion models could be significantly improved simply by re-deriving the coefficients for each setting using the upgraded ‘Deep Lamp’ material, as well as the new reference ‘self-laboratory’ line lists. Increasing exposure depth in current lightly exposed settings would be helpful in this regard. (Cycle 18 GO cal program “Deep Lamp Too”). • Adding single term to existing CALSTIS polynomial, and populating coefficients for an available, but unused term, would achieve significant additional improvement. • Performing a geometrical correction prior to a robust dispersion model (k= k – k0[m]) could lead to a more stable global solution.
Residual Wavelength Errors H-Spectrum & M-Spectrum, Cataloged Lines