Download
1 / 39
390 likes | 532 Vues
Во время этого доклада может возникнуть дискуссия с предложениями конкретных действий. Используйте PowerPoint для записи предложений по ходу обсуждения: Во время демонстрации щелкните правой кнопкой мыши Выберите Записная книжка Выберите вкладку Действия Вводите замечания по мере поступления

E N D
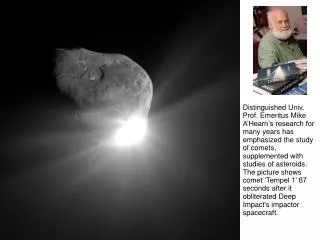
Во время этого доклада может возникнуть дискуссия с предложениями конкретных действий. Используйте PowerPoint для записи предложений по ходу обсуждения: • Во время демонстрации щелкните правой кнопкой мыши • Выберите Записная книжка • Выберите вкладку Действия • Вводите замечания по мере поступления • Нажмите кнопку ОК по завершении доклада В результате в конец презентации автоматически будет добавлен слайд Действия со списком внесенных предложений. Lulin Background Measurement and Detector Issue NuTel project NTU, Taiwan
Outline • Schedule of 2002 • Design of detector/electronics • LuLin test • Calibration • Detector thought • Conclusion
Schedule of 2002 • May – July: design and fabrication of electronics, detector and software. Most was made from scratch. • August – September: debugging full telescope system. • October: LuLin observatory test in moonless nights. • October – December: data analysisand calibration.
Design of detector/electronics • Main task of this design – create a simple equipment for the measurement of background light from a mountain.
Preamplifier schematics - From PMT + From PMT - + Second version (charge -> voltage) Gain~100mV/1p.e RC=500ns First version (current -> voltage) Power supply (16-channels preamplifier): 380mA on +/- 5V (3.8W, 240mW/channel)
Hamamatsu PMT test Uniformity from different channels Measured at NTU Data from Hamamatsu Broken PMT
- + 100 nS Delay line Shaper Design of detector/electronics • Receiver parameters: • Gain: 1 (~100mV/pe) • Noise: ~5mV rms • There is a small problem: an overshoot in the tail. LVDS transmitter Comparator To Trigger From preamp. To ADC
Design of detector/electronics • Trigger: using our TTM2 module made for BELLE experiment (in VME + FPGA based) changing firmware code – one week only! • Use this LVDS-level connector
Design of detector/electronics • Trigger: from TTM2 to NuTel Trigger • Change 3 IC (transmitters onto receivers)
Design of detector/electronics • ADC – use industrial one (Acromag ADC): • Inputs: differential 32 channels for simultaneous conversion • Dead time: ~10 s (8 s – from data sheet!) • Operation clock: 8MHz (there is a jitter 125ns) • Range: +/- 10V (14 bit, 1.25 mV/bin) • Noise: ~1mV (from data sheet) • Problem: a real dead time is a bit larger than from data sheet, so we have low ADC readout rate (most time DAQ resets ADC module due problems in ADC) in case of big event rate (large photon flux), so a most information is from Trigger's counter, which operates with 60MHz clock)
Windows, Visual C++ Trigger SBS PC ADC VME Trigger data ADC data On line trigger Hard disc Buffer RAM Hard disc Histograms Design of detector/electronics • DAQ: • use VME connected with PC via SBS system • Code: Visual C++, Windows
Design of detector/electronics • DAQ: some print-screens from software
Design of detector/electronics • Main task of this design – create a simple equipment for the measurement of background light from a mountain
LuLin test • Some pictures from LuLin observatory
LuLin test • Some pictures from LuLin observatory
LuLin test • Some pictures from night shifts
Siriusseenby prototype at Lulin • Study: • Effective field of view • Lens transmittance as function of off-axis angle. • In the future, • Calibrate the pointing accuracy • Monitoring telescope health
Raw trigger flux Preliminary results are consistent with other measurements. Still need more works.
From LuLin test to Calibration • Setting thresholds on LuLin: • Minimal threshold when noise data (pedestal) are never read from ADC + ~ 1 rotation of variable resistor (~ 50 mV) • Thresholds during calibration: same as on LuLin • Dark current rate from 16 channels: • ~ 10-20 Hz after keeping more then one hour at black box • ~ 100 - 200 Hz on LuLin and at black box after operating with LED light
Calibration • Electronics test with test pulse: • Sensitivity: ~100mV/3.3*10^6 e (1 photoelectron) ADC data with optimized timing. A most noise is due jitter in ADC ADC data with non-optimized timing. Strobe to ADC is delayed on 100 nS from optional timing
Calibration • Electronics test with test pulse: • Cross-talk due electronics: very small We observed a change in pedestals in some channels ~0.3 mV when a signal on neighboring one is ~1.5 V (0.02% !!! cross-talk)
Calibration • Electronics test with pulse to LED + fiber + PMT: • Cross-talk due PMT: ~1% (from data sheet) Cross-talk ~ 0.6% Cross-talk ~ 0.2%
Calibration A noise (r.m.s.) of pedestal distribution varies from 0.6 mV (minimum) to 2.5 mV (maximum). Typical pedestal distribution Pedestals varies from channel to channel in range from –10mV to +4mV
Calibration • Test using LED pulse 100 ns x 1kHz: • Typical histogram in case of big photon flux Pedestal Dark current Light Limit (overflow)
Calibration • LED pulse 100nS x 1kHz (using Trigger) • A gain is about 100 mV, timing optimisation needed
Calibration • LED pulse 100nS x 1kHz (as strobe to ADC) • A gain is about 100 mV, no big differences with previous test => correct thresholds is all 16 channels.
Calibration • LED pulse 100nS x 1kHz • Trigger rate increases with increasing photon flux, then – decreases, limit is 1.4 kHz instead 1kHz LED pulse (dark current rate is 10-20 Hz/channel)
Calibration • LED pulse 100ns x 1kHz • Trigger rate is ~40% large then ADC rate (ADC has dead time ~10 s) – it is due noise on the falling front is not read to ADC, but it is counted at Trigger’s counter. Trigger rate ADC rate
Calibration • Calibration a Trigger rates • Take into account “dead times” • Take into account noise due comparator (40%)
Preamp • Current amp. or charge amp.? • If charge amp., should have a small time constant to avoid a dead time. • Large dynamic range of energy is needed. • 10**15~10**20 eV and a light amount depends on a detector-shower distance. • Multi-gain or logarithmic gain or both? • Space per channel for 8X8 MAPMT is already tight.
Timing measurement • Need to cover a large coincidence time window of 1 us or more a pipeline DAQ. • What clock rate? Normally 40 MHz. • If we can assume a simple and uniform shape, the time resolution can be much smaller than the clock period in offline. • If a pulse shape is complex and not simple depending on a direct Cerenkov or a fluorescence, the rate should be higher.
Trigger • A simple coincidence among detectors may have too many fake triggers. • Time info. must be associated w. the pixel angular info. to reduce the fakes. • The association can be best done in hardware. Possible? • If not, must be done in a higher-level software trigger.Longer time to decide.
Det1 T Det2 T A Candidate combination of Det1 & 2 signals is Searched for in a time window. A trigger accepts a correct combination of Dt and q. Shower Δt12 Det1 Det2 θ
Monitor and control • Ideally a physics event should be used as a monitor. But looks difficult. • Environmental parameters such as temperatures etc. must be measured. • HV/LV monitor and remote control.
Alignment and calibration • Reflected lights of a laser beam can simulate EAS and can be used for alignment. • Need a GPS system for a detector position and a time stamp. • Need a good scheme to synchronize sub-detectors over a long distance. • Is there a gold-plated event available for alignment and calibration?
Need to worry many things PMT/PA Wire/Wireless How to get power. Make SDAQ low-power. SDAQ-MDAQ communication. MAPMT maintenance. Hostile environment. etc. ………..
Conclusion • A telescope (a detector and its electronics) were made in a short time to gain some experience. • Clear signals for a background and Sirius were observed, for demonstration, at Lulin observatory in October moonless nights. • A BG trigger rate was 200 kHzX32 at 1 p.e. threshold. • Calibration is still under way. • A new design of a telescope will be made based on the experience.