Download
1 / 33
330 likes | 443 Vues
Southern States Energy Board. Securing the Nation’s Energy Future: A Southern Perspective Presented to: The Council of State Governments November 13, 2009 Presented by: Kenneth J. Nemeth Secretary & Executive Director Southern States Energy Board. Background.

E N D
Southern States Energy Board Securing the Nation’s Energy Future: A Southern Perspective Presented to: The Council of State Governments November 13, 2009 Presented by: Kenneth J. Nemeth Secretary & Executive Director Southern States Energy Board
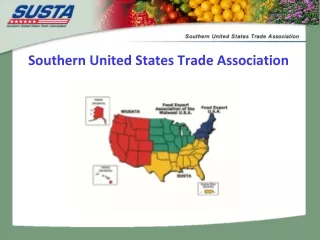
Background Through innovations in energy and environmental policies, programs and technologies, the Southern States Energy Board enhances economic development and the quality of life in the South. - SSEB Mission Statement • Established 1960, expanded in 1978 • 16 U.S. States and Two Territories • Each jurisdiction represented by the governor, a legislator from the House and Senate and a governor’s alternate • Federal Representative Appointed by U.S. President
SSEB Activities Related to Reliable Power Supply • Southeast Regional Carbon Sequestration Partnership • Southern Governors’ Energy Sustainability & Climate Initiative • American Energy Security Study (Phase Two) • Water for Energy • Southern States Biobased Alliance / National biomass Partnership • Nuclear Energy/ Radioactive Materials Transportation Committees • Clean Coal Technology and Advanced Power Systems • CO2 Pipeline and Outer Continental Shelf Study • Advanced Coal Technology Education and Outreach • State Energy Planning • Electric Utility Transmission Planning issues
Current Energy Supply ... at a Crossroads • Price of Energy • Increases • Volatility • Energy Dependency on foreign sources • Climate Change issues are ratcheting up • Administration’s outlook for energy • Energy Policy has become Climate Policy
Significant Global Energy Events 1970 OPEC Sets 55 percent Minimum Tax Rate (1970) U.S. Institutes Price Controls (1971) Arab Oil Embargo Against U.S. (1973) Kissinger Announces “Project Independence” (1974) EPCA Authorizes Strategic Petroleum Reserve (1975) Windfall Profits Tax (1980) Iran/Iraq War – Oil Prices Doubled (1978-1980) World Oil Glut - $29 BBL Oil – U.S. Synfuels Shutdown (1983) Chernobyl Nuclear Accident (1986) Alaska’s Prudhoe Bay Production Peaks (1988) Iraq Invades Kuwait – Prices Soar ($36 BBL) (1990) Clean Air Act – Changes Gasoline & Diesel Fuels (1990) U.S. Imports More Oil & Refined Product Than It Produces (1993) Asian Financial Crisis – Oil Prices Plummet (1997-1998) German Government/Utilities Agree to Phase Out of Nuclear Power (2000) U.S. Petroleum Consumption – All Time High (19.7 Million BPD) (2001) Terrorist Attacks on the U.S. (2001) Photo: Jerry Gay, Seattle Times, 1974 1983 2001
Recent Global Energy Events 2004 Foreign Oil Dependence Rises to 65 percent (2004) Northeast Blackout Leaves 50 Million People in the Dark Natural Gas Prices Triple from 1990 Levels Oil Passes $50/Barrel Gasoline Exceeds $3/Gallon Hurricanes Damage Oil/Gas Rigs Russia Halts Natural Gas to Ukraine Venezuela Moves to Nationalize Resources Oil Breaks $75/Barrel Nigeria Kidnaps Oil Workers Bolivia Secures Oil Fields Experts State Oil Production May Have Peaked Iran Threatens Nuclear Capabilities Saudis Talk of Propping Up $55 Oil Chad Orders Chevron to Leave BP Forced to Repair Pipeline Leaks China Extends Credit to Oil Nations Iran, Russia, Others Discuss Gas OPEC Texas Utilities Cancel 8 of 11 Coal Plants Oil Breaks $144/Barrel Oil returns to $81/Barrel after fall to mid-30s 2005 2009
ELECTRICITY:Electricity Increasingly Important in the 21st Century Examples of electricity’s potential this century to address: • Energy challenges, electricity use and energy conservation • Environmental, sustainability and climate change issues • Economic development • Transportation issues • Improving people’s standard of living • Health, medicine and bio-tech • Continuing developments in communications IT, etc. • The productivity challenge, electricity use and productivity growth • Others include: Emerging electro-technologies, new industries, nanotechnology, robotics, superconductivity, space exploration
Electricity Generation: U.S. Government Forecast 26% Growth 2030 4902 TWh 2007 3903 TWh *Base case from EIA “Annual Outlook 2009”
ELECTRICITY:Electricity Demand is Outpacing Generation Growth • U.S. generation capacity reserve margins have greatly declined • 30-40% in early 1990s • 16% in 2008 • Margins to fall below 13% reference minimum in next 3-5 years in Southeast • Generation capacity to grow 8.4%in the next 10 years while demand grows 14.8% • Source: NERC 2009 Long Term Reliability Assessment, North American Electric Reliability Corporation study +14.8% +8.4% Growth in U.S. ElectricityDemand 2009-18 Growth in U.S.Generating Capacity 2009-18
ELECTRICITY: Situation More Critical in Certain Regions Supply margins become critical in: • SERC (Southeastern): 2013 • SPP: 2016 • WECC (Rocky Mountain): 2012 • ERCOT (Texas): 2016 • California: 2018 • NPCC (New England): 2016 • Arizona, New Mexico, Nevada: 2018 • MRO (Midwest): 2012 Source: NERC 2009 Long-Term Reliability Assessment, October 2009
ENERGY RESOURCES: Global Energy Forms Face Limits in Supply & Price All Energy Forms Needed for Diversity of Supply • ENERGY EFFICIENCY/DEMAND-SIDE MANAGEMENT/CONSERVATION: An important resource but insufficient to power the future • OIL: Consistently above $50/barrel; declining reserves; risky sources • NUCLEAR: Valuable but constrained due to safety and waste disposal concerns • HYDRO: No growth in supply • WIND: Limited availability; grid disruptions; erratic supply • ETHANOL: Clean but energy inefficient; cellulosic key • NATURAL GAS: Price volatility; declining reserves; risky sources • COAL: Faces GHG, climate change, regulators, environmental organizations challenges • SOLAR: Cost of materials; regional effectiveness; intermittent
Meeting Future Electricity Needs - Barriers • Impact of Environmental Initiatives • Fuel switch - coal to gas • Price volatility, Delivery mechanism, Access to LNG • Need effective integration & verification of demand-side resources (Demand response : offset ~80% peak growth in 2016) • Uncertainty on environmental requirements • Lack of Transmission infrastructure • Getting renewables to market (750% growth in wind by 2017, eg) • “Complex but surmountable” (Moeller, FERC) • Transmission miles inadequate (9.5% increase from 2008-2017) • Smart grid paradox • Oversold in residential markets • Key is in wholesale market (Phasors, substation technology) • Financeability and Financing new infrastructure • Cost & environmental regulatory uncertainty & risk • Capability of Financial markets
DOE Recognition of CCS as Critical Technology Solution “We must make it our goal to advance Carbon Capture and Storage Technology to...widespread, affordable deployment in 8 – 10 years.” Secretary Chu Federal investments of $4 Billion with $7 Billion from industry in US • $1 Billion for FutureGen with CCS by 2016 • $1.4 Billion for five commercial scale demonstration projects at coal plants • $1.3 Billion for additional five demos to retrofit industrial facilities with CCS • $100 million demonstration for innovative use of CO2 • $20 million training grants for workforce training • $400 million in 2010 for new capture and compression technologies • $500 million, 10 year investment through regional partnerships • US-China Clean Energy Research Center
CO2 Reductions… Technical Potential Achieving all targets is very aggressive, but potentially feasible.
CLIMATE: SECARB Partnership Objectives • Characterize the potential carbon sequestration sinks in the Southeast; • Conduct field verification studies in the most promising geologic formations in the region; • Advance the state of the art in monitoring, measurement and verification techniques and instrumentation; and • Develop sequestration technologies and characterize geologic sinks for future readiness.
Reducing Energy Demand:The Low Hanging “Fruit” • Expedited permits • Weatherization • Improve energy performance in government buildings • Alternative fueled government vehicles • Renewable portfolio standards • Efficiency standards for boilers, appliances, electronics • Building code upgrades • Tax incentives for “green” buildings
Energy Efficiency and Renewables • Efficiency in existing assets • Transmission • Generation • States with Renewable Electricity Standards • 29 States (6 with goals) • EPA – DOE Energy Star Program • DOE Office of Energy Efficiency and Renewable Energy • National Energy Efficiency Action Plan • Recognize Energy Efficiency as priority resource • Commitment to implement cost-effective energy efficiency as resource • Communicate benefits and opportunities • Robust funding to deliver where cost-effective • Align utility incentives with energy efficiency through ratemaking practices
Wind • Map shows potential for wind generation • Wind Speed is Key • Capacity Factor 25 – 35% • 31,100 MW in US • Growth 32%/year past 5 yrs • 8,400 MW added in 2008 • 5,600 MW under construction • Transmission issues- • “Complex, but Surmountable” • Largest wind states: • Texas – 8,800 MW • Iowa – 3,050 MW • California – 2,800 MW • 7 more states > 1,000 MW
Solar • Map shows potential for solar energy • Cloud Cover and Darkness key • Water use is challenge • Southwest – 500 MW plants • Southeast : • FPL Group – 110 MW @ 3 sites and 75 MW PV solar plant • Duke Energy (NC)– 16 MW PV Solar farm plus 10 MW solar energy system • Sun Hours / Day sample cities, on peak: • Phoenix, AZ 7.1 • Lexington KY 6.0 • Charleston, WV 4.1 • Tampa, FL 6.2 • Atlanta, GA 5.2 • El Paso,TX 7.4
Combined Heat & Power Applications • CHP role in the national energy supply • 85 GW nationwide (9% of US Capacity) • Texas 16.8 GW (7.5 past 10 yrs) • Louisiana 7.0 GW (3.1 past 10 yrs) • Alabama 3.4 GW (1.9 past 10 yrs) • Large CHP Applications • Chemicals • Refining • Pulp and Paper • Food Processing • Other opportunities • Data Centers • Utilities • Municipalities (wastewater, schools) • Barriers to reaching potential • Few technology improvements needed • Higher efficiency engines & turbines • Low electricity prices and natural gas price volatility • Uncertainty on carbon policy • Credit and financing • Awareness of potential
The Dash to Gas • Natural Gas is replacing Coal as base load generating option • Short lead time • Easier to site • Lower carbon emissions • Lower capital costs • Small increments of capacity • Issues • Natural gas supply security • Gas price volatility • Stress of gas supply and transportation infrastructure • Switch to gas could change transmission flow patterns
Status of Coal-Fired Power Plants in the U.S. • 84 coal-fired projects underway (38 progressing / 46 announced : 47,000 MW ) • Coal Plant construction lagging – Actual << Planned (2002 Report) • Plan for 2007 = 36,000 MW • Actual 2007 = 4,500 MW • Delays, Cancellations • Regulatory Uncertainty, Climate Change • Economic conditions • Escalating costs • Recent completions • Oak Grove (TX) – 817 MW lignite (Luminant) • 1990-2007 Averaged ~ 1000 MW/ year in U.S. • Skilled resources reduced • Scarcity of labor in power plant engineering, procurement, project management, construction activities • Impact of Coal Ash Spill at TVA plant (Kingston)
Nuclear Power Future in the United States • Blueprint for 100 New Nuclear Plants – 20 Years* • Low Cost Clean Energy Plan • Build 100 nuclear power plants in 20 years • Electric cars • Offshore exploration for natural gas & oil • Double energy R&D for renewable energy • Why aren’t we building nuclear capacity? • Nuclear is very clean & unique energy source • Nuclear power plants are safe • Nuclear plants can be insured • Clean and Safe Energy Coalition (Christine Todd Whitman) • Nuclear power Benefits: Base load, carbon free, low operating cost, reduced water use • Congressional appetite for Nuclear • Included in Senate Energy and Climate Bill *Lamar Alexander
Update on Electricity Issues in the 111th Congress • Stimulus Funding • Energy Efficiency and Renewable Energy - $17 Billion • Electricity Delivery, Reliability, Fossil Energy - $22 Billion • Waxman-Markey Highlights- American Clean Energy & Security Act • Title I. Clean Energy • Energy Efficiency & Renewable Electricity Standard • Promotes CCS • Smart Grid, Transmission Planning • Nuclear Guarantee programs • Title II. Energy Efficiency Buildings • Title III. Reducing Global Warming Pollution • Cap and Trade • Offsets • Title IV. Transitioning (Competitiveness, Green jobs) • Senate: Kerry-Boxer bill – Clean Energy Jobs and American Power Act • $10 Billion over 10 years for CCS (includes carbon storage stewardship fund) • Natural Gas investment incentives • Nuclear incentives • Renewable energy and energy efficiency • Clean Energy workforce training
Climate Change: Impacts of Cap & Trade Provisions in Federal Legislation • Cap & Trade Provisions • Similar in both House and Senate version – GHG Emission Reductions: • House: 17% below 2005 by 2020; 83% by 2050 • Senate: 20% below 2005 by 2020; 83% by 2050 • Key Question: • What does Cap & Trade cost? • Forecasting Impacts on the economy • Difficulty of forecasting beyond 2030* • Regulatory standards could change • Technological breakthroughs • Other unforeseen events • Key information from forecasts • Sensitivity of program provisions to varying economic, technological and behavioral assumptions • Insights on costs and benefits, in general *CRS Examination of 7 studies projecting costs of HR 2454
Climate Change: CRS Report: Impacts of Cap & Trade Provisions in Federal Legislation (HR 2454) • Studies Reviewed by CRS Report • EPA • EIA • National Black Chamber of Commerce • Heritage Foundation • Congressional Budget Office • American Council for Capital Formation/ National Assoc of Manufacturers • MIT • Key Insights • Cost determined by response of economy to technological challenges • Allocation of allowance value determines who bears the cost of the program • Availability of offsets is key in determining costs • Interplay between nuclear, renewable, natural gas, coal plants with CCS technology emphasize need for low-carbon source of electric generating capacity in mid- to long-term • Attempts to estimate household effects fraught with numerous difficulties • Environmental benefits must take into account global context
Climate Change: Impacts of Cap & Trade Provisions in Federal Legislation • Estimated cost impacts- Annual Household effects in 2020 • EPA $69 - $86 • EIA $110 • CBO $156 • MIT $262 • NBCC $739 • Heritage Foundation $808 • HF* $1,262 • EPA forecast of Economic Impacts of S. 1733 • $0.23 – 0.29 $/day per household OR $84 - $106 in 2020 • Heritage Foundation Estimate of Gross State Product by geographic region (GSP Loss in 2012- by district) • West Virginia -$179 to -$275 million • Texas -$216 to -$825 million • Arizona -$192 to -$470 million
Regulatory and Other Issues • EPA’s Endangerment Determination • 2007 Massachusetts v. EPA • EPA Greenhouse Gas Reporting Rule • March 2009 proposal for 2010 implementation • Requires facilities emitting >25,000 tons GHG to file report • Issued under statutory mandate from 2007 appropriations bill • Public comment period closed in June- ruling imminent • EPA Class VI Well designation for CO2 injection • July 2008 requirements updated with new field data, August 31 • Rule expected late 2010/early 2011 • International Climate Change Issues- Copenhagen • December 2009 • Pore Space Ownership • Wyoming as example • IOGCC model statutes and regulations • Senator John Barrasso (WY) pore space ownership bill (S.1856) under federal lands
Securing a Sustainable Energy Future • Energy Efficiency • Building Codes • Combined Heat & Power • Natural Gas • Nuclear • Energy Star Programs • Carbon Capture & Storage Infrastructure • Low-Carbon Energy Source Development • Transmission Infrastructure • Renewable Energy Zones
Kenneth J. Nemeth, Secretary Southern States Energy Board nemeth@sseb.org (770) 242~7712 PLEASE VISIT: www.sseb.org www.americanenergysecurity.org www.sercarbon.org