Download
1 / 69
690 likes | 870 Vues
Statistical Analysis of Social Networks. From description to Inference: Confidence intervals for measures QAP models: Networks as independent variables Networks as dependent variables P* and Markov Chain Monte Carlo (MCMC). Statistical Analysis of Social Networks.

E N D
Statistical Analysis of Social Networks • From description to Inference: Confidence intervals for measures • QAP models: • Networks as independent variables • Networks as dependent variables • P* and Markov Chain Monte Carlo (MCMC)
Statistical Analysis of Social Networks Confidence Intervals: Bootstraps and Jackknifes (Snijders & Borgatti, 1999) Goal: “Useful to have an indication of how precise a given description is, particularly when making comparisons between groups.” Assumes that “a researcher is interested in some descriptive statistic … and wishes to have a standard error for this descriptive statistic without making implausibly strong assumptions about how the network came about.”
Confidence Intervals: Bootstraps and Jackknifes (Snijders & Borgatti, 1999) Jackknifes. Given a dataset w. N sample elements, N artificial datasets are created by deleting each sample element in turn from the observed dataset. In standard practice, the formula for the standard error is then:
Jackknifes: Example on regular data • Obs i x s1 s2 s3 s4 s5 s6 s7 s8 s9 s10 • 1 1 0.85 . 0.85 0.85 0.85 0.85 0.85 0.85 0.85 0.85 0.85 • 2 2 0.70 0.70 . 0.70 0.70 0.70 0.70 0.70 0.70 0.70 0.70 • 3 3 1.00 1.00 1.00 . 1.00 1.00 1.00 1.00 1.00 1.00 1.00 • 4 4 0.59 0.59 0.59 0.59 . 0.59 0.59 0.59 0.59 0.59 0.59 • 5 5 0.22 0.22 0.22 0.22 0.22 . 0.22 0.22 0.22 0.22 0.22 • 6 6 0.69 0.69 0.69 0.69 0.69 0.69 . 0.69 0.69 0.69 0.69 • 7 7 0.43 0.43 0.43 0.43 0.43 0.43 0.43 . 0.43 0.43 0.43 • 8 8 0.32 0.32 0.32 0.32 0.32 0.32 0.32 0.32 . 0.32 0.32 • 9 9 0.50 0.50 0.50 0.50 0.50 0.50 0.50 0.50 0.50 . 0.50 • 10 0.67 0.67 0.67 0.67 0.67 0.67 0.67 0.67 0.67 0.67 . • MEAN: 0.60 0.57 0.58 0.55 0.60 0.64 0.59 0.61 0.63 0.61 0.59
Jackknifes: Example on regular data SEj = 0.0753 SE = 0.0753
Jackknifes: For networks For networks,we need to adjust the scaling parameter: Where Z-i is the network statistic calculated without vertex i, and Z-• is the average of Z-1 … Z-N. This procedure will work for any network statistic Z, and UCINET will use it to test differences in network density.
Jackknifes: For networks An example based on the Trade data. Density, Std. Errors and confidence intervals for each matrix. DIP_DEN DIP_SEJ DIP_UB DIP_LB 0.6684783 0.0636125 0.7931588 0.5437978 CRUDE_DEN CRUDE_SEJ CRUDE_UB CRUDE_LB 0.5561594 0.0676669 0.6887866 0.4235323 FOOD_DEN FOOD_SEJ FOOD_UB FOOD_LB 0.5561594 0.0633776 0.6803794 0.4319394 MAN_DEN MAN_SEJ MAN_UB MAN_LB 0.5615942 0.0724143 0.7035263 0.4196621 MIN_DEN MIN_SEJ MIN_UB MIN_LB 0.2445652 0.0530224 0.3484891 0.1406414
Bootstrap In general, bootstrap techniques effectively treat the given sample as the population, then draw samples, with replacement, from the observed distribution. For networks, we draw random samples of the vertices, creating a new network Y* If i(k) = i(h), then randomly fill in the dyads based from the set of all possible dyads (I.e. fill in this cell with a random draw from the population).
Bootstrap • For each bootstrap sample: • Draw N random numbers, with replacement, from 1 to N, denoted i(1)..i(N) • Construct Y* based on i(1)..i(N) • Calculate the statistic of interest, called Z*m, • Repeat this process M (=thousands) of times.
Bootstraps: Comparing density BOOTSTRAP PAIRED SAMPLE T-TEST -------------------------------------------------------------------------------- Density of trade_min is: 0.2446 Density of trade_dip is: 0.6685 Difference in density is: -0.4239 Number of bootstrap samples: 5000 Variance of ties for trade_min: 0.1851 Variance of ties for trade_dip: 0.2220 Classical standard error of difference: 0.0272 Classical t-test (indep samples): -15.6096 Estimated bootstrap standard error for density of trade_min: 0.0458 Estimated bootstrap standard error for density of trade_dip: 0.0553 Bootstrap standard error of the difference (indep samples): 0.0719 95% confidence interval for the difference (indep samples): [-0.5648, -0.2831] bootstrap t-statistic (indep samples): -5.8994 Bootstrap SE for the difference (paired samples): 0.0430 95% bootstrap CI for the difference (paired samples): [-0.5082, -0.3396] t-statistic: -9.8547 Average bootstrap difference: -0.3972 Proportion of absolute differences as large as observed: 0.0002 Proportion of differences as large as observed: 1.0000 Proportion of differences as large as observed: 0.0002
Measurement Sensitivity • A related question: How confident can you be in any measure on an observed network, given the likelihood that observed ties are, in fact, observed with error? • Implies that some of the observed 0s are in fact 1s and some of the 1s are in fact 0s. • Suggests that we view the network not as a binary array of 0s and 1s, but instead a set of probabiliites, such that: • Pij = f(Aij) • We can then calculate the statistic of interest M times under different realizations of the network given Pij and get a distribution of the statistic of interest.
Measurement Sensitivity • It seems a reasonable approach to assessing the effect of measurement error on the ties in a network is to ask how would the network measures change if the observed ties differed from those observed. This question can be answered simply with Monte Carlo simulations on the observed network. Thus, the procedure I propose is to: • Generate a probability matrix from the set of observed ties, • Generate many realizations of the network based on these underlying probabilities, and • Compare the distribution of generated statistics to those observed in the data. • How do we set pij? • Range based on observed features (Sensitivity analysis) • Outcome of a model based on observed patterns (ERGM)
Measurement Sensitivity As an example, consider the problem of defining “friendship” ties in highschools. Should we count nominations that are not reciprocated?
Measurement Sensitivity Reciprocated All ties
Modeling Social Networks parametrically: p* approaches A long research tradition in statistics and random graph theory has lead to parametric models of networks. These are models of the entire graph, though as we will see they often work on the dyads in the graph to be estimated. Substantively, the approach is to ask whether the graph in question is an element of the class of all random graphs with the given known elements. For example, all graphs with 5 nodes and 3 edges, or, put probabilistically, the probability of observing the current graph given the conditions.
Random Graphs and Conditional Expectations The basis for the statistical modeling of graphs rests on random graph theory. Simply put, Random graph theory asks what properties do we expect when ties (Xij) form at random. The simplest random graph is the Bernoulli random graph, where Xij is a constant and independent: says simply that each edge in the graph has an independent probability of being “on.” Typically this is an uninteresting distribution of graphs, and we want to know what the graph looks like conditional on other features of the graph.
Random Graphs and Conditional Expectations A Bernoulli graph is only conditional on the expected number of edges. So effectively we ask “What is the probability of observing the graph we have, given the set of all possible graphs with the same number of edges.” We might, instead, want to condition on the degree distribution (sent or received) or all graphs with a particular dyad distribution (same number of Mutual, Asymmetric and Null dyads). Closed form solutions for some graph statistics (like the triad census) are known for out-degree, in-degree and MAN (but not all 3 simultaneously).
Random Graphs and Conditional Expectations PAJEK gives you the unconditional expected values: ------------------------------------------------------------------------------ Triadic Census 2. i:\people\jwm\s884\homework\prison.net (67) ------------------------------------------------------------------------------ Working... ---------------------------------------------------------------------------- Type Number of triads (ni) Expected (ei) (ni-ei)/ei ---------------------------------------------------------------------------- 1 - 003 39221 37227.47 0.05 2 - 012 5860 9587.83 -0.39 3 - 102 2336 205.78 10.35 4 - 021D 61 205.78 -0.70 5 - 021U 80 205.78 -0.61 6 - 021C 103 411.55 -0.75 7 - 111D 105 17.67 4.94 8 - 111U 69 17.67 2.91 9 - 030T 13 17.67 -0.26 10 - 030C 1 5.89 -0.83 11 - 201 12 0.38 30.65 12 - 120D 15 0.38 38.56 13 - 120U 7 0.38 17.46 14 - 120C 5 0.76 5.59 15 - 210 12 0.03 367.67 16 - 300 5 0.00 21471.04 ---------------------------------------------------------------------------- Chi-Square: 137414.3919*** 6 cells (37.50%) have expected frequencies less than 5. The minimum expected cell frequency is 0.00.
Random Graphs and Conditional Expectations SPAN gives you the (X|MAN) distributions: Triad Census T TPCNT PU EVT VARTU STDDIF 003 39221 0.8187 0.8194 39251 427.69 -1.472 012 5860 0.1223 0.1213 5810.8 1053.5 1.5156 102 2336 0.0488 0.0476 2278.7 321.01 3.1954 021D 61 0.0013 0.0015 70.949 67.37 -1.212 021U 80 0.0017 0.0015 70.949 67.37 1.1027 021C 103 0.0022 0.003 141.9 127.58 -3.444 111D 105 0.0022 0.0023 112.39 103.57 -0.727 111U 69 0.0014 0.0023 112.39 103.57 -4.264 030T 13 0.0003 0.0001 3.4292 3.3956 5.1939 030C 1 209E-7 239E-7 1.1431 1.1393 -0.134 201 12 0.0003 0.0009 42.974 38.123 -5.017 120D 15 0.0003 286E-7 1.3717 1.368 11.652 120U 7 0.0001 286E-7 1.3717 1.368 4.8122 120C 5 0.0001 573E-7 2.7433 2.7285 1.3662 210 12 0.0003 442E-7 2.1186 2.1023 6.8151 300 5 0.0001 549E-8 0.2631 0.2621 9.2522
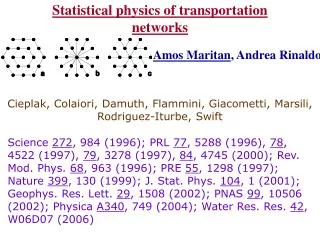
Modeling Social Networks parametrically: p* approaches The earliest approaches are based on simple random graph theory, but there’s been a flurry of activity in the last 10 years or so. Key references: - Holland and Leinhardt (1981) JASA - Frank and Strauss (1986) JASA - Wasserman and Faust (1994) – Chap 15 & 16 - Wasserman and Pattison (1996) Thanks to Mark Handcock for sharing some figures/slides about these models.
Modeling Social Networks parametrically: p* approaches Where: q is a vector of parameters (like regression coefficients) z is a vector of network statistics, conditioning the graph k is a normalizing constant, to ensure the probabilities sum to 1.
Modeling Social Networks parametrically: p* approaches The simplest graph is a Bernoulli random graph,where each Xij is independent: Where: qij= logit[P(Xij= 1)] k(q) =P[1 + exp(ij )] Note this is one of the few cases where k(q) can be written.
Modeling Social Networks parametrically: p* approaches Typically, we add a homogeneity condition, so that all isomorphic graphs are equally likely. The homogeneous bernulli graph model: Where: k(q) =[1 + exp(q)]g
Modeling Social Networks parametrically: p* approaches If we want to condition on anything much more complicated than density, the normalizing constant ends up being a problem. We need a way to express the probability of the graph that doesn’t depend on that constant. First some terms:
Modeling Social Networks parametrically: p* approaches
Modeling Social Networks parametrically: p* approaches Note that we can now model the conditional probability of the graph, as a function of a set of difference statistics, without reference to the normalizing constant. The model, then, simply reduces to a logit model on the dyads.
Modeling Social Networks parametrically: p* approaches Fitting p* models. I highly recommend working through the p* primer examples, which can be found at: http://kentucky.psych.uiuc.edu/pstar/index.html Including: A Practical Guide To Fitting p* Social Network Models Via Logistic Regression The site includes the PREPSTAR program for creating the variables of interest. The following example draws from this work.
Modeling Social Networks parametrically: p* approaches: Fitting models We can model this network based on parameters for overall degree of Choice (), Differential Choice Within Positions (W), Mutuality(), Differential Mutuality Within Positions (W), and Transitivity (T). The vector of model parameters to be estimated is: = { WWT }.
Modeling Social Networks parametrically: p* approaches: Fitting models The first step is to calculate the vector of change statistics. This is done by first calculating the value of the statistic if the ij tie is present, then if it is absent, then take the difference. The program PREPSTAR does this for you (see also pspar – for large networks: http://www.sfu.ca/~richards/Pages/pspar.html) For example, the simple choice parameter is Xij, so if forced present Xij=1, if absent, Xij=0, the difference is going to be 1. Since this is true for every dyad, it is a constant, equivalent to the model intercept.
The model described above would be written in W&P notation as: • z1(x) = L = i,j Xij is the statistic for the Choice parameter, , • z2(x) = LW= i,j Xij ij is the statistic for the Choice Within Positions parameter, W, • z3(x) = M = i<j Xij Xjiis the statistic for the Mutuality parameter, , • z4(x) = MW = i<j Xij Xji ijis the statistic for the Mutuality Within Positions parameter, W, • z5(x) = TT= i,j,k Xij Xjk Xikis the statistic for the Transitivity parameter, T. • Note that the indicator variable ij=1 if actors i and j are in the same position, and 0 otherwise.
Looking over the first few cases: Obs i j tie L L_W M M_W T_T --- --- --- --- --- --- --- --- --- 1 1 2 1 1 1 1 1 2 2 1 3 1 1 1 0 0 3 3 1 4 0 1 0 0 0 1 4 1 5 0 1 0 0 0 0 5 1 6 0 1 0 0 0 2 6 2 1 1 1 1 1 1 1 7 2 3 1 1 1 1 1 2 8 2 4 0 1 0 0 0 2 9 2 5 0 1 0 0 0 0 10 2 6 0 1 0 0 0 3 11 3 1 0 1 1 1 1 3 12 3 2 1 1 1 1 1 1 13 3 4 1 1 0 0 0 3 14 3 5 0 1 0 0 0 2 15 3 6 1 1 0 1 0 2 16 4 1 0 1 0 0 0 0 17 4 2 0 1 0 0 0 1 18 4 3 0 1 0 1 0 3 19 4 5 1 1 1 1 1 0 20 4 6 1 1 1 1 1 1
Modeling Social Networks parametrically: p* approaches: Fitting models proclogistic descending ; tie = l lw m mw tt / noint; run;
Modeling Social Networks parametrically: p* approaches: Fitting models One practical problem is that the resulting values are often quite correlated, making estimation difficult. This is particularly difficult with “star” parameters. lw m mw tt lw 1.00000 0.58333 0.80178 0.15830 0.0007 <.0001 0.4034 m 0.58333 1.00000 0.80178 -0.02435 0.0007 <.0001 0.8984 mw 0.80178 0.80178 1.00000 -0.11716 <.0001 <.0001 0.5375 tt 0.15830 -0.02435 -0.11716 1.00000 0.4034 0.8984 0.5375
Modeling Social Networks parametrically: p* approaches: Fitting models • Parameters that are often fit include: • Expansiveness and attractiveness parameters. = dummies for each sender/receiver in the network • Degree distribution • Mutuality • Group membership (and all other parameters by group) • Transitivity / Intransitivity • K-in-stars, k-out-stars • Cyclicity
Modeling Social Networks parametrically: Exponential Random Graph Models In practice, p* models are difficult to estimate, and we have no good sense of how approximate the PMLE is. A recent generalization is to use MCMC methods to better estimate the parameters. The following slides are courtesy of David Hunter at Penn State.
Modeling Social Networks parametrically: Exponential Random Graph Models: Degeneracy "Assessing Degeneracy in Statistical Models of Social Networks" Mark S. Handcock, CSSS Working Paper #39
Modeling Social Networks parametrically: Exponential Random Graph Models: Degeneracy "Assessing Degeneracy in Statistical Models of Social Networks" Mark S. Handcock, CSSS Working Paper #39
Modeling Social Networks parametrically: Exponential Random Graph Models: Degeneracy "Assessing Degeneracy in Statistical Models of Social Networks" Mark S. Handcock, CSSS Working Paper #39