Download
1 / 1
10 likes | 317 Vues
Bus Route Schedule Adherence Assessment Using Automatic Vehicle Location (AVL) Data. Master’s thesis: Peng Wanga , Advisors: Jie (Jane) Lin, Darold Barnumc Department of Civil and Materials Engineering & Institute for Environmental Science and Policy,

E N D
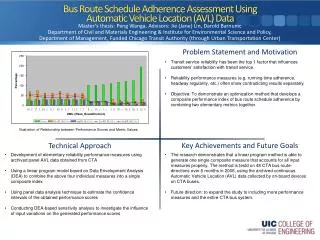
Bus Route Schedule Adherence Assessment Using Automatic Vehicle Location (AVL) Data Master’s thesis: PengWanga, Advisors: Jie (Jane) Lin, DaroldBarnumc Department of Civil and Materials Engineering & Institute for Environmental Science and Policy, Department of Management, Funded Chicago Transit Authority (through Urban Transportation Center) • Transit service reliability has been the top 1 factor that influences customers’ satisfaction with transit service. • Reliability performance measures (e.g. running time adherence, headway regularity, etc.) often show contradicting results separately. • Objective: To demonstrate an optimization method that develops a composite performance index of bus route schedule adherence by combining two elementary metrics together. Illustration of Relationship between Performance Scores and Metric Values • Development of elementary reliability performance measures using archived panel AVL data obtained from CTA • Using a linear program model based on Data Envelopment Analysis (DEA) to combine the above four individual measures into a single composite index • Using panel data analysis technique to estimate the confidence intervals of the obtained performance scores • Conducting DEA-based sensitivity analysis to investigate the influence of input variations on the generated performance scores • The research demonstrates that a linear program method is able to generate one single composite measure that accounts for all input measures properly. The method is testd on 48 CTA bus route-directions over 6 months in 2006, using the archived continuous Automatic Vehicle Location (AVL) data collected by on-board devices on CTA buses. • Future direction: to expand the study to including more performance measures and the entire CTA bus system.