
Uploaded by
may-stein
3 SLIDES
158 VUES
30LIKES
Comprehensive Analysis of Limpopo Region: Data Insights from Additional File 3
DESCRIPTION
This document presents a detailed analysis of the Limpopo region based on the data from Additional Files 3a, 3b, and 3c. It includes various evaluations for different parameter settings (K=2 to K=15) to explore patterns and insights in the data. Utilizing statistical methods and graphical representations, the analysis aims to uncover significant trends in the Limpopo region, aiding in research, policy-making, and regional development planning. The findings can be beneficial for stakeholders interested in understanding the dynamics of the area.
Download
1 / 3
Télécharger la présentation 
Comprehensive Analysis of Limpopo Region: Data Insights from Additional File 3
An Image/Link below is provided (as is) to download presentation
Download Policy: Content on the Website is provided to you AS IS for your information and personal use and may not be sold / licensed / shared on other websites without getting consent from its author.
Content is provided to you AS IS for your information and personal use only.
Download presentation by click this link.
While downloading, if for some reason you are not able to download a presentation, the publisher may have deleted the file from their server.
During download, if you can't get a presentation, the file might be deleted by the publisher.
E N D
Presentation Transcript
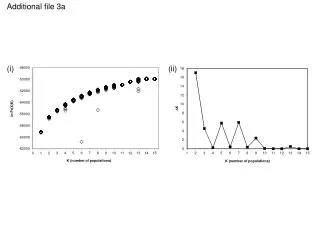
Additionalfile3a (i) (ii)
Limpopo N 406 Limpopo S Additionalfile3b Chefu K=2 K=3 K=4 K=5 K=6 K=7 K=8 K=9 K=10 K=11 K=12 K=13 K=14 K=15


More Related