Stress and Strain
Stress and Strain. Lab 4. To understand how engineers compare different materials. To understand how a strain gage works. To understand important issues for data acquisition. To understand the need for experimental data. To understand some basic structural features of a bicycle.


Stress and Strain
E N D
Presentation Transcript
Stress and Strain Lab 4 Winter Quarter
To understand how engineers compare different materials. To understand how a strain gage works. To understand important issues for data acquisition. To understand the need for experimental data. To understand some basic structural features of a bicycle. To make measurements on a statically loaded bicycle. To understand why different materials are used to make bicycles. Objectives Winter Quarter
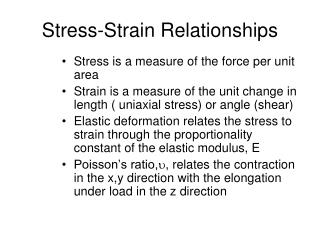
Strain: Stress: Hooke’s law: Where: E = Modulus of Elasticity s = stress e = strain For the bike fork material E = 29.0 x 10⁶ psi. Stress vs. Strain Winter Quarter
Loads applied by rider STRAIN GAGE A sensor that measures strain When the bicycle is loaded (a person is riding), the fork is loaded. Due to the load, the fork deforms. The STRAIN GAGE is used to measure the strain in the fork. Measuring Load on a Bicycle Fork Winter Quarter
Loads applied by rider Compression Shearing Bending The fork is loaded by a combination of compression shear and bending Loads applied by the road Loads on a Bicycle Fork Winter Quarter
Strain Gage Data Acquisition System Wheatstone Bridge + Amplifier Data Processing Conditioning Circuits Transducer Recorder Converts measured quantity to measurable electrical quantity Records amplifier output. Recorder may be analog or digital Converts transducer output to electrical signal to be amplified Computer analysis, display graphs, tables Winter Quarter
The strain gage is a resistor. Its resistance changes if its length changes. Measured Quantity: strain Measurable Electrical Quantity: resistance. The strain gage is cemented to the bicycle fork. When the bicycle is loaded the fork is strained and the strain gage resistance changes. Backing Film Grid (electrical resistor) Copper-plated Solder tabs Transducer: Strain Gage Winter Quarter
Where: Sg is the “gage factor” and e is the strain. or Strain Gages • Resistance is Proportional to Length Winter Quarter
Conditioning Module: Wheatstone Bridge • The strain gages are connected as the four resistors in the Wheatstone Bridge. • The bridge converts the change in the strain gage resistance to an output voltage (Vout) that is proportional to the strain in the fork due to the forces acting on the fork. The output voltage is fed to an amplifier. Winter Quarter
The change in the output voltage from the Wheatstone Bridge is related to the strain of the strain gage by: Where: Vin = 5.0 volts A = 500 (amplification) Sg = 2.085 (gage factor) The equation can be solved to give the strain as a function of the output voltage. Conditioning Module: Wheatstone Bridge Winter Quarter
Lab Experience: Part 1 – Static Test • The goal in this part of the lab is to find a correlation between the weight of the bicycle rider and the stress/strain due to loading of the front fork. • Set up the data logger as described in the quick reference guide. Record each rider’s weight. • With the bike trainer attached to the bicycle, collect data with the data logger for each member of your group. Use the following sequence to collect one set of data (all times are approximate). Do not stop the data logger between each step or between each rider. • 5 seconds for an unloaded bike. • 5-10 seconds for rider 1 in riding position (no pedaling). • 15 seconds for rider 1 pedaling. • Repeat for remaining team members. • Upload your data from the data logger to the PC. Export your data as an ASCII file (consult the quick reference guide) and save it on a diskette. Winter Quarter
Lab Experience: Part 2 – Dynamic Test • The goal in this part of the lab is to observe the loading conditions in the front fork of a bicycle while being ridden, and to compute the maximum and minimum stress values. • Select the lightest and heaviest person in your team. These two will ride the bike. • Set up the data logger as described in the Quick Reference Guide. Use the “real-time data acquisition” mode to view the data collected by the data logger. • Make sure that the initial output signal without a rider is near two volts. Record the obtained value. • With each rider sitting still, record the output signal (in volts). Record the weights of each rider. • Reset the data logger to have an acquisition rate of 50 Hz. • Take the bicycle outside following the instructor’s direction and have both riders ride the bike for about 45 seconds each. Leave the bike sit unloaded between riders for a few seconds so you know when you switched riders. • Bring the bike back to the lab. Upload your data from the data logger to the PC. Export your data as an ASCII file (consult the Quick Reference Guide) and save it on a diskette. Winter Quarter
Lab Report Guidelines • Cover page including name, class, team #, date and instructor. • Use the sample lab report format given. • Lab Experience: • PART 1: Static Test • Plot the raw voltage data vs. time and identify each event on the graph, i.e. unloaded bike, rider 1 gets on, rider 1 sits on bike, rider 1 pedals bike, etc. • Calculate the strain and the stress at each data point. • Create a graph of stress vs. time. Label your graph. • Using average value of stress for each rider in the riding position while pedaling, create a plot of stress vs. weight of each rider. Create a linear trend line for the data and show the equation of the line on the graph. • Include sample calculations (calculating strain from voltage, calculating stress from strain) Winter Quarter
Lab Report Guidelines • PART 2: Dynamic Test • Plot raw voltage data vs. time. • Modify your assignment E13 to determine the maximum and minimum peak stresses and the corresponding elapsed times when they occur for your data. Document your program and tabulate the obtained results. • For each rider, compare the maximum and minimum stress values to the ones obtained from the static test. What is the ratio of the two quantities? • Analysis of Plots/Results. • Conclusions Winter Quarter
Recall that Dvout = Vin .A . Sg . e where: Vin= supply voltage (5.0) DVout= change in voltage Sg= gage factor (2.085) A= amplification (500) e= strain. also, where: E = Modulus of Elasticity s= stress e = strain For the bike fork, E = 29.0 x 10⁶ psi. Equations Winter Quarter