Download
1 / 21

E N D
Image: iStock 10 September 2020 © Council on Energy, Environment and Water 2020
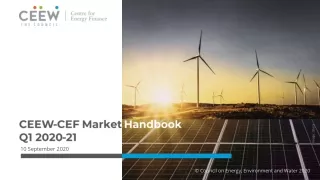
India is undergoing an energy transition from fossil-based to clean energy. Evidence-based decision-making can accelerate the process. The handbook attempts to comment and answer on some critical questions such as: CEEW Centre For Energy Finance’s Market Handbook aims to help key investors, executives and policymakers with evidence-based decision-making by: 1. What is India’s generation capacity and energy mix? • Identifying and analysing trends critical to India’s energy transition 2. What are the key trends in renewable energy (RE) tariffs? 3. What is the current situation of the discom payment delay situation? • Presenting data-backed evidence based on the most relevant indicators 4. How have the power market reforms progressed? • Connecting the dots and presenting a short-term market outlook 5. What are key trends in the electric vehicles (EV) and energy storage markets? cef.ceew.in
4 Generation Capacity And Energy Mix 6 Coal Phase-Out RE Auctions 7 8 Discom Payables 9 Power Markets Policy and Regulatory Developments 10 11 Renewable Energy Finance 14 Energy Storage Image: iStock 15 Electric Mobility Annexures 17 19 About Us cef.ceew.in
4 Installed capacity mix* (GW) 100% Takeaways & Outlook 10% 15.5 11% 18.5 12% 31.7 12% 29.5 12% 24.5 12% 27.5 13% 38.8 18% 57.3 20% 69.0 22% 77.6 22% 79.4 23% 82.6 23% 84.4 23% 86.8 24% 87.7 90% 15% 41.3 14% 42.8 17% 40.5 No noticeable gas/diesel, nuclear and hydro capacity additions since FY18. 18% 39.5 23% 36.9 22% 37.6 20% 39.0 80% 14% 44.5 13% 45.3 13% 45.4 13% 45.4 12% 45.4 12% 45.4 12% 45.7 12% 45.7 70% Coal/lignite capacity grew at a compounded annual growth rate (CAGR) of 9% in the last decade. RE capacity grew at 19% (off a relatively low base of 15.5 GW in FY10) for the same period. 60% 50% 40% 62% 185.2 62% 164.6 60% 145.3 59% 192.2 58% 130.2 57% 191.2 56% 200.7 56% 200.7 56% 112.0 56% 203.2 56% 205.3 55% 205.3 55% 205.4 30% 54% 93.9 53% 84.2 Here onwards, RE capacity will need to grow at a CAGR of 16% to reach the 450 GW target by 2030. 20% 10% 0% Quarterly RE capacity additions have slowed down in the last four quarters. Pace of grid scale solar & wind capacity additions are by and large a function of auctions held in the preceding 12-24 months. FY10 FY11 FY12 FY13 FY14 FY15 FY16 FY17 FY18 FY19 Q1 FY20 Q2 FY20 Q3 FY20 Q4 FY20 Q1 FY21 Coal/Lignite Gas/Diesel Nuclear Hydro Renewables* Source: Central Electricity Authority. *Does not include solar roof-top capacity (2.8 GW as of June 2020) RE capacity addition (MW) Solar (grid-scale and rooftop) contributed nearly 84% of the RE capacity addition in Q1 FY21. 5,000 443 4,000 NA 188 28 488 375 Despite Covid-19, 12 GW of solar and 400 MW of solar–wind hybrid capacity was sanctioned/auctioned in Q1 FY21. This is equivalent to an impressive 14% of India’s aggregate installed RE capacity of 87.7 GW. 3,000 676 277 845 254 55 78 391 NA 2,000 841 0 NA 28 348 0 302 247 2,968 463 30 322 2,189 1,000 1,878 28 1,692 160 1,426 1,371 1,229 999 717 0 Q1 FY19 Q2 FY19 Q3 FY19 Q4 FY19 Q1 FY20 Q2 FY20 Q3 FY20 Q4 FY20 Q1 FY21 Solar (grid-scale) Wind Small hydro Bio-power Solar (roof-top) Source: Ministry of New and Renewable Energy. cef.ceew.in
5 Source-wise daily generation (Q1 FY21) Takeaways & Outlook Highest RE share 16.0% on 28thMay Lowest RE share 8.8% on 30thJune 4,500 18% Total generation for Q1 FY21 was down by 15.9% from Q1 FY20 due to the Covid-19 nationwide lockdown. • April: Down by 23.8% • May: Down by 14.6% • June: Down by 9.8% • Total Q1 FY21: Down by 15.9% 4,000 16% Energy generation (million kWh) 3,500 14% 3,000 12% 2,500 10% 2,000 8% 1,500 6% Fall in total generation mainly attributable to coal/lignite (down 24.2% vs Q1 FY20). 1,000 4% From a share of total generation perspective, RE and hydro are on the rise, whereas coal/lignite is on a decline. • RE: Share up from 9.9% to 11.8% • Hydro: Share up from 10.0% to 12.1% • Coal/lignite: Share down from 73.1% to 65.9% 500 2% 0 0% 2-Jun 4-Jun 6-Jun 8-Jun 1-May 3-May 5-May 7-May 9-May 11-Apr 13-Apr 15-Apr 17-Apr 19-Apr 21-Apr 23-Apr 25-Apr 27-Apr 29-Apr 1-Apr 3-Apr 5-Apr 7-Apr 9-Apr 10-Jun 12-Jun 14-Jun 16-Jun 18-Jun 20-Jun 22-Jun 24-Jun 26-Jun 28-Jun 30-Jun 11-May Solar Biomass/Other RES 13-May 15-May 17-May 19-May 21-May 23-May 25-May 27-May 29-May 31-May Gas/Naptha/Diesel RE share % RE share % Coal Wind Hydro Lignite Nuclear RE share snapshot Q1 FY19 Q1 FY20 Q1 FY21 With a high wind season extending till July– August, relatively less variable (vs wind) solar insolation across the year, and upcoming RE capacity addition, RE’s share of total generation expected to remain high in Q2 FY21. RE share % Day RE share % Day RE share % Day Highest 16.2% 12 June 2018 15.3% 17 June 2019 16.0% 28 May 2020 Lowest 6.2% 3 April 2018 7.4% 2 April 2019 8.8% 30 June 2020 Average 9.0% NA 9.9% NA 11.8% NA Source: POSOCO. Note: RE technologies include solar, wind, biomass, waste to energy and small hydro and does not include rooftop solar and hydro generation. cef.ceew.in
6 Coal capacity added versus retired (MW) Takeaways & Outlook 3,652 3,300 Although still net positive (additions less retirement), the pace of new coal capacity addition has declined sharply. 2,130 2,100 With INR 1,06,908 crore of power sector loans turning non-performing (per RBI as of September 2019), incremental bank lending to the sector faces challenges. Many banks may also be approaching statutory limits on power sector exposure. 1,320 1,230 895 860 705 270 214 110 100 45 30 0 0 0 While data for RE loan book component of aggregate power sector exposures is not readily available, anecdotal evidence suggests that RE loans as a category have performed much better than power sector as a whole. Q1 FY19 Q2 FY19 Q3 FY19 Q4 FY19 Q1 FY20 Q2 FY20 Q3 FY20 Q4 FY20 Q1 FY21 Capacity added Capacity retired Source: Central Electricity Authority Coal financing by Power Finance Corporation (PFC)/ Rural Electrification Corporation (REC) (INR cr) PFC/REC continues to back coal projects in India, although their share in its loan book has started to decline (from 63% in Q2 FY19 to 58% in Q4 FY20). To compensate, exposure to RE and hydro projects has increased, which now account for 6% and 5% of its loan book, respectively. 20000 65% 10,955 63% 63% 62% 5,992 10000 3,498 61% 2,740 2,479 61% 1,488 0 60% Q1 FY19 Q2 FY19 Q3 FY19 Q4 FY19 Q1 FY20 Q2 FY20 Q3 FY20 Q4 FY20 With declining RE plus storage tariffs (already reached 4.04 INR/kWh), operational coal fleets are expected to come under increasing pressure. -1,538 60% -10000 59% 58% -12,012 -20000 55% Change in gross loan assets for conventional generation (excludes large hydro and renewables) % share of conventional generation in total gross assets Source: PFC investor presentations; figures are derived from the same. Note: Sector-wise break up of PFC loan asset data unavailable for Q1 FY20. cef.ceew.in
7 Key auction results (last 6 months) Bid spotlight: SECI round-the- clock (RTC-I), 400 MW Capacity allotted (MW) Least tariff discovered (INR/kWh) Takeaways & Outlook Tariff and winner Pan-India (SECI) solar, Tranche-IX, 2,000 MW (June 2020) Pan-India (SECI) solar-wind- storage, RTC-I, 400 MW (May 2020) 2.36 2,000 • Tariff: INR 2.90/kWh (first year) with an annual escalation of 3%. Levelised cost of energy (LCOE) of INR 3.60/kWh • Winner: ReNew Power All time low RE tariff (2.36 INR/kWh) was discovered in SECI Tranche-IX, with a 2,000 MW bid, owing to low entry barriers and high competition between participants, backed by foreign investors. 2.90 400 Pan-India (NHPC) solar, 2,000 MW (April 2020) 2.55 2,000 Key provisions India’s first hybrid RE bids concluded with tariffs of 6.12 INR/kWh (LCOE of 4.04 INR/kWh) for assured peak power supply for six hours and 2.90 INR/kWh (LCOE of 3.60 INR/kWh) for round-the-clock energy supply, with a minimum 80% CUF requirement. • Round-the-clock energy supply with a combination of solar, wind, and storage technologies. Provision to locate solar and wind plants at different locations • Minimum monthly and yearly capacity utilization factor (CUF) requirements of 70% and 80%, respectively • Excess energy generation may be sold in open markets with the facility of additional connectivity Gujarat (GUVNL) solar, 500 MW- VII (March 2020) 2.61 350 Maharashtra (MSEDL) solar, 500 MW (March 2020) 2.90 350 Pan-India (SECI) solar, Tranche-VIII, 1200 MW (February 2020) Government actions include the removal of tariff caps on solar and wind auctions to improve investor sentiment. 2.50 1,200 Maharashtra (MSEDL) solar, Agro-feeder scheme, 1350 MW (February 2020) 3.28 283 The implementation of the safeguard duty (SGD) may not impact solar tariffs, as the duty lapses in July 2021. Module procurement for new projects can be timed to take place once the duty lapses. Analysis Assam (APGCL) solar, 70 MW (February 2020) 70 3.99 • Bid allows significant oversizing of the project and does not require firm power. • As per a CEEW-CEF analysis, the project would require 1,200 MW wind and 300 MW solar and around 1.0–1.5 GWh of energy storage. • In addition, such capacity oversizing is expected to lead to monthly CUFs of 150–180% during the high wind season (May–July) and 70–72% CUF in September–October. UP (UPNEDA) solar, 500 MW (February 2020) 184 3.17 With increasing RE share and discoms facing integration challenges, we expect more hybrid auctions going forward, with firm, flexible, and dispatchable RE procurement. Pan-India (SECI) solar-wind- storage, Peak power supply, 1,200 MW (January 2020) 6.12 1,200 Pan-India (SECI) solar, Manufacturing, 7,000 MW (January 2020) 12,000 2.92 Source: SECI and state renewable agencies. SECI = Solar Energy Corporation of India; RTC = Round the clock cef.ceew.in
8 Takeaways & Outlook Amount overdue by discoms to power producers (INR cr) Discom payable and receivable days for RE rich states 250 As of June 2020, the amount overdue from discoms was INR 1,30,895 crore, representing an increase of 71% compared to June 2019. 90 days RJ 130,895 UK June 2020 UP 124,916 May 2020 AP ↑ 30% 200 113,130 There has been a 30% spike in overdues in just the three-month period since March 2020. April 2020 Power purchase payable days TS* 105,600 March 2020 150 108,290 February 2020 KA Discoms continue to struggle with ensuring timely collections. The Ministry of Power (MoP) allowed a three-month moratorium for payments to conventional power producers (March 2020) but no relaxation for payments to RE developers. 106,232 January 2020 TN BH ↑ 71% CG 103,843 December 2019 100 90 days 101,441 November 2019 GJ* AS 101,443 KL* October 2019 MP MH Highest payment delays in Rajasthan, Uttar Pradesh, Uttarakhand, Andhra Pradesh, Telangana, Karnataka, Bihar, and Tamil Nadu. PJ 50 89,756 September 2019 HR* 86,129 August 2019 82,227 July 2019 With MoP’s moratorium on payments due to conventional power producers, the overdue amount may increase at a higher rate in the coming months. 0 0 50 100 150 200 250 300 76,701 June 2019 Power sale receivable days Source: PRAAPTI portal (Based on voluntary disclosure from power producers). Source: UDAY portal (Based on data disclosed by discoms as of 31st Mar 2020. *Data not available for these states; values derived from 2018-19 financial reports). The Electricity (Amendment) Bill 2020 mandating that discoms maintain adequate payment security may facilitate timely payment to power producers, if passed in parliament. INR 90,000 crore liquidity package was announced in May 2020 to provide a temporary relief to electricity discoms in paying to power producers. Since then, the overdue amount has increased to INR 1,30,895 crore as of June 2020. cef.ceew.in
9 Power supply position (Peak demand, GW) REC market prices (IEX, INR/MWh) 180.5 182.5 2,400 183.5 183.7 181.0 177.4 176.8 177.4 176.8 182.5 2,000 2,000 2,000 2,000 Takeaways & Outlook 132.8 133.3 1,600 1,500 1,000 1,300 Peak power and energy demand are expected to recover to FY20 levels in the following quarter as the Covid-19 lockdown is lifted. 1,000 1,000 1,000 2019 2020 2019 2020 April May June It is evident that the REC market is maturing, with a proposed market-based price discovery system (removal of floor price by CERC). As such, REC prices are expected to reduce in the coming months. April May June Solar REC price Non Solar REC price Peak demand Peak demand met Source: POSOCO Peak demand declined considerably by 25% in April 2020 (as compared to April 2019) due to the Covid-19 nationwide lockdown. Despite a recovery in peak power demand in May 2020, the energy demand was still lower by 14% as compared to May 2019. Source: Indian Energy Exchange (IEX). REC prices have been declining from Q1 FY20 to Q1 FY20 owing to lower demand following the Covid-19 lockdown. The buy to sell bid ratio declined from 3.4 in Q1 FY19 to 1.1 in Q1 FY20. Short-term electricity prices (in both the day- ahead and real-time spot markets) have been at record lows, at 2.35 INR/kWh and 2.22 INR/kWh, respectively. This is expected to result in an increase in the share of short-term electricity procurement in the overall electricity procured by discoms. Real time spot market snapshot (IEX) Day ahead spot market snapshot (IEX) Volume (million kWh) Price (INR/kWh) 3.53 3.51 3.33 4.00 10,000 Max (Daily) 36.1 3.03 With the introduction of real-time markets, ’gate closure’ to segregate the day-ahead and real-time markets, and system balancing (ancillary services), overall power purchase cost may see a reduce. Future rollouts of market-based economic dispatch and ancillary services market are envisaged to further accelerate this reduction. 2.00 5,000 2.57 2.47 Min (Daily) 3.4 1.56 2.35 3,772 4,207 4,005 Total/Average (Monthly)* 515.5 2.22 3,692 5,574 4,174 0.00 0 April May June *Monthly figures since real time market commenced in the last month of Q1 2020 (June) Volume (2020), Million units Price (2020), INR/kWh Source: IEX. Volume (2019), Million units Price (2019), INR/kWh Source: IEX. The real-time market with trading in 15-minute time blocks commenced from 1 June 2020. The average price discovered was 2.22 INR/kWh. Average day-ahead spot market prices declined by 29% in Q1 FY21 (compared to Q1 FY20), with an overall volume increase of 12%, owing to lower electricity demand due to the Covid-19 lockdown. cef.ceew.in
10 Draft Electricity (Amendment) Act of 2003 Creation of FDI and project development cells in MNRE Real-time market goes live Takeaways & Outlook Proposed amendments to the Electricity Act of 2003 broadly aim to improve contract enforcement, mitigate offtake and payment risk for RE developers, promoting renewable energy with a dedicated policy and obligations for discoms to procure hydro power. Establishment of a central body, Electricity Contract Enforcement Authority, to resolve PPA related disputes within 120 days. Selection of ERC members to be centralised; one member must mandatorily be a legal professional. Central government to specify the modalities of a payment security mechanism and the bundling of hydro with thermal energy. LDCs empowered to regulate electricity dispatch to states in case of inadequate payments from discoms. National RE policy notified with penalties for states for non- compliance with RPO; HPO (hydro) also introduced. Electricity tariffs to be determined by states without subsidy; DBT for electricity subsidy. Reduction of cross-subsidies and associated surcharges to follow the trajectory specified in the tariff policy. Creation of FDI cell in the MNRE for processing FDI proposals from countries that share land borders in India. Creation of a project development cell in the MNRE to create projects with all approvals, land availability, and detailed project reports for adoption/investment by investors With effect from 1 June 2020, the real-time electricity market went live. IEX and PXIL work in coordination with NLDC on trade and transmission corridor availability. Half-hour trading windows with gate closure defined at 90 minutes before the actual delivery. • • • • • • Reforming electricity distribution proposed through phasing out cross-subsidies and alternative PPP business models. • • Removal of floor price from the REC market to lower the price of RECs, thereby encouraging discoms and corporate consumers to meet their RE obligations through the REC market. • Imposition of safeguard duty on import of solar panels Removal of floor price for RECs • CERC proposes a floor price (minimum) of INR 0/MWh; this was INR 1,000/MWh in 2017. Forbearance price (maximum) of INR 1,000/MWh; this was INR 2,400/MWh in 2017. The Supreme Court dismissed the Green Energy Association’s (GEA) appeal seeking a stay order on CERC’s mandate to remove the floor price. • An SGD of 14.9% has been imposed for the period of August 2020 to January 2021; 14.5% SGD for February to July 2021. The government plans to implement a basic customs duty (BCD) on solar cells and modules soon and will share details over the next few months. • Increasingly, Indian corporate electricity consumers have been committing to 100% RE consumption (e.g., Mahindra & Mahindra, Tata Motors, and Infosys). A liquid REC market is expected to accelerate this transition. • • • • • SGD will have a limited impact on manufacturing and RE tariffs. Current projects will not be impacted by the change in the law clause. Source: Publicly available information. cef.ceew.in
11 Key deals (Q1 FY21) Takeaways & Outlook Acquisition Target: Emami Group’s power business | Acquirer: Brookefield Asset Management, Canada Q1 FY21 Impressive 12.4 GW of RE capacity sanctioned/auctioned in Q1 FY21, but highly concentrated in the hands of a few developers. Market concentration in sanctioned RE capacity Note: Market concentration has been calculated as the ratio of top five RE capacities sanctioned, to the total RE capacity sanctioned June ‘20 Amount: Not available Acquisition June ‘20 Target: Climate Connect (AI & analytics in power market) Acquirer: ReNew Power Amount: Not available Adani Green Energy exercised its green- shoe option to develop an additional 6 GW of solar capacity under the manufacturing linked tender (1.5 GW additional solar manufacturing). This (6 GW) is reportedly the single largest solar capacity award to date globally. Developer-wise RE capacity sanctioned during Q1 FY21 (12,400 MW) . Equity investment Target: SILRES (Subsidiary of SunEdison Infra) | Acquirer: Fenice Investment Group Operational RE capacity in India (MW) May ‘20 Amount: INR 18.8 cr (USD 2.5 million) Adani Green… 2,030 6,000 Active participation from companies backed by foreign investors in the SECI 2 GW auction drove solar tariffs to their all time low of 2.36 INR/kWh. Pre-series A round funding (April 2020) Azure Power 1,808 2,000 ReNew Power 5,440 800 Company: Mysun (Rooftop) Investor(s): Existing investors Amount: INR 32.0 cr (USD 4.2 million) April ’20 SoftBank Group… 2,000 600 Market concentration is expected to remain high going forward. Dominant players will have an edge in raising and pricing capital at the scale required to match India’s ambitious RE capacity additions. EDEN… 207 600 Asset sale (5 projects) Target: Shapoorji Pallonji Infra Capital | Acquirer: KKR Axis Energy… 306 400 April ’20 EQT, Temasek 380 0 Amount: INR 1554 cr (USD 204 million) Avaada Energy 320 680 Enel Green Power 300 172 Equity investment: 37.5% (April 2020) Safeguard duty is expected to be levied only till July 2021. Depending on commissioning deadlines, developers may have the flexibility to procure modules and avoid its impact. Solarpack 300 160 Target: Rising Sun Energy Acquirer: Yinson Renewables (Malaysia) Amount: INR 55.4 cr (USD 7.4 million) April ’20 CDC Group 300 NA IB Vogt 300 0 AMP Energy… 450 100 Source: Publicly available information. Source: CEEW Centre for Energy Finance cef.ceew.in
12 Change in key renewable energy stock prices (indexed to 100) 300.0 273.0 Takeaways & Outlook 250.0 229.4 Share prices of pure play RE developers such as Adani Green and Azure Power attracted increased investor interest in the immediate aftermath of the Covid-19 disruption which otherwise saw global stock markets fall sharply in March 2020. Value of stocks (indexed to 100) Covid-19 nationwide lockdown announcement 200.0 150.0 Rising RE developer share prices in the wake of Covid-19 seems to be global trend, not only limited to Indian developers1. 127.7 100.0 112.1 100.0 Share prices of even smaller RE developer- manufacturer companies such as Suzlon Energy and Inox Wind have outperformed the Sensex which was down 14.3% as of June 2020 (vs Dec 2019). The former (Suzlon) has also benefitted from a debt restructuring. 85.7 67.9 50.0 0.0 Other listed RE companies such as Sterling Wilson Solar (EPC) and Borosil Renewables (glass manufacturing) have been affected by specific issues. A delayed promoter loan repayment overhang in the case of the former, and supply chain disruptions in the case of the latter. Dec-19 Jan-20 Feb-20 Mar-20 Apr-20 May-20 Jun-20 Azure Power Global Ltd (NYSE) Suzlon Energy (BSE) Sensex Adani Green Energy (BSE) Sterling & Wilson Solar (BSE) Inox Wind (BSE) Borosil Renewables (BSE) Source: Money Control. 1 https://oilprice.com/Energy/Energy-General/10-Energy-Stocks-Defying-The-COVID-19-Slump.html cef.ceew.in
13 Bond yields and key financial rates Takeaways & Outlook 14.0% 13.5% Adani Green Energy and ReNew Power have been among the most active among RE developers in India (see Annexure I). The key purpose of such capital raises has been to refinance existing debt with some portion left over for capacity expansion. 13.0% Covid-19 nation-wide lockdown announcement 12.5% 12.0% 11.5% 11.0% 10.5% 10.0% Covid-19 prompted the RBI to lower its repo rate to an all time low of 4.00% (lower than the 4.75% set during the 2008–09 financial crisis). 9.5% 9.0% 8.5% 8.0% Yields for internationally listed bonds of Indian RE developers saw a brief period of dramatic rise in March 2020. However, this shock in terms of rising yields (falling bond prices) appears to have been a temporary aberration, with yields now moving towards their pre Covid-19 levels. 7.5% 7.0% 6.5% 6.0% 5.5% 5.0% Interestingly, at a time of falling bond prices, the stock prices of RE developers moved up sharply (previous slide). 4.5% 4.0% 3.5% 3.0% Due to low liquidity in the Indian bond market and credit rating constraints (most RE project loans are typically rated below AA, the minimum requirement for issuance), we may continue to see international bond issuances from Indian RE developers. Jun-19 Jul-19 Aug-19 Sep-19 Oct-19 Nov-19 Dec-19 Jan-20 Feb-20 Mar-20 Apr-20 May-20 Jun-20 Repo rate SBI MCLR (1-year) Treasury bond yield (INR, 10-year) NTPC bond yield (INR, 8.66%, 10-year) ReNew Power bond yield (USD, 6.67%, 5-year) Adani Green bond yield (USD, 6.25%, 5-year) Source: Reserve Bank of India, State Bank of India, Trading Economics, Money Control and BondEvalue. cef.ceew.in
14 USD/kWh Project location & issue date Application & technology Details Current average battery prices (lithium-ion) Generation 14 MW solar with 42 MWh BESS Expected bid conclusion in Q2 FY21 Leh & Kargil (SECI), January 2020 Grid-scale renewables with battery PPA price trends in India (INR/kWh) versus US (USD/MWh) Takeaways & Outlook Andaman & Nicobar Islands (SECI), January 2020 Generation 4 MW floating solar with 2 MW BESS Expected bid conclusion in Q2 FY21 The key driver for energy storage growth has been the co-location of storage with RE generation projects; e.g., 1.2 GW tender in India (2019) with assured peak power supply for 6 hours (50% capacity). The PPA price discovered was 4.04–4.30 INR/kWh (54–58 USD/MWh). Southern Bighorn Solar & Storage Center, Nevada US 2023 Eland Solar Farm, California US 2023 SECI Assured Peak Power Supply, India 2022 1.64; 21.90 Generation 400 MW with solar, wind and storage hybrid Bid concluded in May 2020 with tariff of 3.60 INR/kWh 2.14; 28.50 Delhi and Dadra & Nagar Haveli (SECI), October 2019 4.04; 54.00 Recent hybrid (RE + battery) project tariffs discovered in the US reached a record low of 1.64– 2.14 INR/kWh (21.8–28.5 USD/MWh) for 4- hour backup (45–75% capacity). Arrow Canyon Solar, Nevada US 2021 Generation 1.95 MW solar with 2.15 MWh BESS Expected bid conclusion in Q2 FY21 1.64; 21.80 Lakshadweep (SECI), September 2019 India seems to be nearly 5 years behind in terms of PPA prices Dodge Flat Solar, Nevada US 2020 1.73; 23.10 Battery storage prices and levelised tariffs have been rapidly declining due to the supersizing of battery capacities, anywhere from 400 to 1,200 MWh, thereby driving costs down. Generation 100 MW solar, solar- wind or small hydro with storage Haryana (UHBVN/DHBVN), September 2019 Expected bid conclusion in Q2 FY21 RE Mustang, California US 2020 2.39; 31.80 Eland Project, California US 2019 3.00; 40.00 India is expected to have more hybrid (RE + storage) auctions of higher capacities in the future as the chief tendering agency (SECI) plans to come up with such tenders on demands from discoms to meet their renewable obligations and tackle grid-level integration challenges simultaneously. Generation 1,200 MW assured peak power supply with storage Bid concluded in Jan 2020 with tariff of 4.04 - 4.30 INR/kWh Pan India (SECI), August 2019 TEP, Arizona US 2017 3.38; 45.00 KIUC, Hawaii US 2017 8.14; 108.50 Andhra Pradesh (AP Transco), February 2019 Transmission 400 MW with 8 hours of daily discharge KIUC, Hawaii US 2015 Bid cancelled 10.43; 139.00 Source: SECI and state renewable agencies. Source: Gormon, Mills, Bolinger, Wiser, Singhal, Ela, and O’Shaughnnessy (2020); LBNL; and BNEF (2020). Exchange rate = 75.0 INR/USD cef.ceew.in
15 Electric vehicle sales in India 180,000 1.60% Takeaways & Outlook 166,289 Overall, battery-operated vehicle (BOV) and hybrid vehicle sales declined dramatically by 72.4%, from 60,924 units in Q1 FY20 to 16,978 units in Q1 FY21. 160,000 1.40% 146,574 140,000 1.20% BOV and hybrid vehicles sales grew with a CAGR of 90.4% between FY16 and FY20. 120,000 1.00% Two- and three-wheeler sales (e- rickshaws) are key drivers of EV sales growth in India, contributing more than 97% to annual sales (2019–20). 96,993 96,788 100,000 90,034 0.80% 80,000 With the gradual easing up of the lockdown, monthly EV sales initially recovered in June 2020; this may be attributed to pent-up demand. 0.60% 56,648 60,000 52,840 0.40% Though the festive season from September to November may push EV sales further up, annual automobile sales (for FY21) are forecasted to be nearly 45% lower than in FY20, as per SIAM estimates. 40,000 6,183 19,730 6,260 18,062 1,277 0.20% 20,000 901 1,662 1,981 515 Range anxiety and high prices remain key challenges. 0 0.00% FY06 FY07 FY08 FY09 FY10 FY11 FY12 FY13 FY14 FY15 FY16 FY17 FY18 FY19 FY20 Apr-20 May-20 Jun-20 Battery operated vehicles (BOV) Hybrid vehicles BOV and hybrid vehicles as % of overall vehicle sales Source: Vahan Sewa dashboard (Includes only registered vehicles. Unregistered vehicles include low-speed (< 25 km/hr), e-rickshaws (three-wheelers) and electric two-wheelers), Electric Mobility Dashboard, CEEW Centre for Energy Finance cef.ceew.in
You can find us at cef.ceew.in | @CEEW_CEF Authors Nikhil Sharma (nikhil.Sharma@ceew.in) Arjun Dutt (arjun.dutt@ceew.in Saloni Jain (saloni.jain@ceew.in) Gagan Sidhu (gagan.sidhu@ceew.in) cef.ceew.in
17 Size (USD million) Coupon rate (%) Tenor (Years) Date Company Sector Rating Purpose BB-/Stable (Fitch) January 2020 ReNew Power 450 Solar and wind 5.875% 5 Refinancing of maturing debt October 2019 Adani Green Energy Repaying foreign currency loans and rupee borrowings 362.5 Solar and wind 4.625% BBB- (Fitch) 20 October 2019 Solar, wind, and electric vehicles Urja Global 500 Not available Not available Not available Not available September 2019 Azure power 350 Solar 5.65% Not available 5 Refinancing of existing debt September 2019 Ba2 Capacity expansion and repaying high cost debt ReNew Power 300 Solar and wind 6.45% 5 (Moody's) October 2019 Ba1 Greenko 950 Solar and wind 5.50% 5 Refinancing of solar and wind projects (Moody’s) Adani Green Energy June 2019 500 Solar 6.25% BB+ (Fitch) 5 Refinancing of solar projects March 2019 Capex and refinancing of outstanding ECB ReNew Power 375 Solar and wind 6.67% BB (Fitch) 5 January 2019 Tata 25.6 Solar and wind Not available Not available Not available Capacity expansion Cleantech US Treasury + 1.65% (US investors) 3 Libor + 1.51% (British investors) September 2018 State Bank of India 650 Solar and wind BBB- (Fitch) 5 Investment in RE projects Source: Climate Bonds Initiative and company press releases cef.ceew.in
18 FAME-II target met as of 21stJuly 2020 Public charging stations As of December 2019 INR/kWh Note: Target of selling 1,562,000 EVs (2W, 3W, 4W and buses) under FAME-II scheme by FY22 Recent electric vehicle launches EV charging service fee Electric cars (4W) per public charging station Ampere Electric Magnus Pro India Price: INR 73,990 Range: 75 km Battery capacity: 60 V, 30 Ah INR/km Average EV cab tariffs China Gemopal Electric Miso Note: Average internal combustion engine (conventional) cab tariffs are around 16.4 INR/km Price: INR 44,000 Range: 60 - 75 km Battery capacity: 48 V, 17.5 Ah Germany Bajaj Chetek Urbanite Price: INR 1,00,000 - 1,15,000 Range: 95 km Battery capacity: 3 kWh Japan Lakh INR MG Motors ZS EV Price range for an electric car (sedan) Price: INR 20,88,000 - 23,58,000 Range: 340 km Battery capacity: 75 kWh US Source: Electric Mobility Dashboard, CEEW Centre for Energy Finance cef.ceew.in
19 cef.ceew.in
20 Build evidence Create coherence Design solutions Design and feasibility pilots of fit-for- purpose business models & financial solutions for clean energy solutions Consistent, reliable, and up to date monitoring & analysis of clean energy markets – investment, payment schedules, market trends, etc. Periodic convening of multi-stakeholder groups to deliberate on market activities in clean energy cef.ceew.in
21 Cheaper Finance is Key to Lowering RE Tariffs in Indonesia Jobs, Growth and Sustainability Accelerating RE Investments in Sri Lanka RE-Financing India’s Energy Transition CEEW-CEF Dashboard Open Access Tool Electric Mobility Dashboard cef.ceew.in