Achieving Targets in HIV Care: A Cascade Approach Webinar Overview
610 likes | 735 Vues
This webinar explores the challenges and strategies for achieving key targets in HIV care. It discusses low target performance examples and the dimensions of monitoring and evaluation (M&E) in clinical settings. The session introduces a cascade approach to enhance overall care by addressing the various steps in a clinical pathway. Participants will learn about baseline data collection, prioritizing interventions, and the significance of a toolkit inventory. Case studies from Swaziland and Mozambique illustrate the impact of these strategies on ART retention and pediatric TB screening.

Achieving Targets in HIV Care: A Cascade Approach Webinar Overview
E N D
Presentation Transcript
Achieving Program Targets: An HIV Care Cascade Approach Molly McNairy and Bill Reidy, ICAP-NY March 28, 2013
Webinar Overview • Background • Examples of low target performance • Dimensions of the problem: M&E & Clinical • Introduce a cascade approach • A case study • Toolkit inventory
Webinar Overview • Background • Examples of low target performance • Dimensions of the problem: M&E & Clinical • Introduce a cascade approach • A case example • Toolkit inventory
Background • There are many reasons why a program may face challenges reaching key targets • Even the highest-functioning program can have low target performance • It is important that we address these challenges on an ongoing basis • Country teams have various methods for monitoring progress to targets (e.g., ongoing DQA, reports to funders, slide sets, URS)
URS Targets Dashboardhttps://urs2.icap.columbia.edu/#dashboard Filter by country and time period
URS Targets Dashboard Export data to Excel sheet
Webinar Overview • Background • Examples of low target performance • Dimensions of the problem: M&E & Clinical • Introduce a Cascade approach • A case example • Toolkit inventory
Retention on ART: Mozambique Target = 85% retained 59% * 50% *Excludes patients who transferred out
Pediatric TB screeningOne OPD facility: Tanzania Target = 100% screened 32% 25% 8%
Webinar Overview • Background • Examples of low target performance • Dimensions of the problem: M&E & Clinical • Introduce a Cascade approach • A case example • Toolkit inventory
Low performance may have multiple and overlapping M&E-Clinical components • Data quality • Data availability • M&E system issues • Structural barriers • Staffing issues • Health system issues Solution = must include both components
Webinar Overview • Background • Examples of low target performance • Dimensions of the problem: M&E & Clinical • Introduce a cascade approach • A case study • Toolkit inventory
A Cascade Approach: Why? • A care cascade outlines the multiple steps in a clinical pathway needed to achieve optimal health outcomes. • The target of interest is part of a larger cascade of care in which the previous steps affect the target • Improving the entire cascade will lead to improvements in the target as well as other targets simultaneously • Improving the entire cascade will lead to more sustainable improvements
Steps in the Cascade Approach • Identify steps in the cascade that relate to target • Identify baseline data to operationalize the cascade • Choose priority sites • Choose interventions and prioritize them • Use a cohort methodology to monitor progress
1. Identify steps in the cascade that relate to target • The cascade’s steps are specific to the disease (i.e. HIV, TB) and the patient population (i.e. adults, children, pregnant women/infants).
Adult Care & Treatment ART Eligible Link McNairy, El-Sadr AIDS 2012
Tuberculosis TB Suspect TB Treatment TB Treatment Success TB Disease Prevent recurrence, ongoing screening Retain, counsel monitor and support Screen Evaluate for TB disease Fayorsey, Howard 2013
2. Identify Baseline Data to Operationalize Cascade • Where to get baseline data for a cascade? • Routinely-reported M&E data, e.g.: • Country aggregate databases • URS • Original data collection from clinics
What source to use for baseline data? • Routinely-reported M&E data • Advantages: • historical data is readily available • data available for many facilities • collection requires no additional efforts • Disadvantages: • indicators not flexible (may not measure what you need) • data may have quality issues • Particular danger when target shortfall is in part due to M&E system issues
What source to use for baseline data? • Original data collection from clinic • Advantages: • have access to all data collected • high level of flexibility in defining set of indicators • can use highest-quality data available • may be used to compare to reported M&E data • Disadvantages: • burden of data collection • lack of a large amount of historical data for comparison • If at all possible, advisable to collect original data to supplement routine M&E data
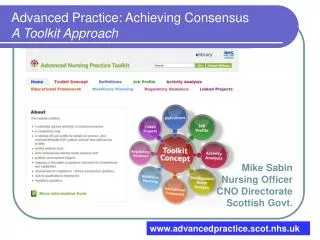
3. Determining & Prioritizing Interventions • Root cause Analysis/Driver Diagram • Focusing Matrix
Driver Diagram • A tool to facilitate root cause analysis • Articulates the aim of the campaign • Organizes primary categories for reasons contributing to low performance • Subdivides categories into specific reasons • Facilitates a specific intervention tied to each reason An example…
Secondary Drivers Interventions Primary Drivers Aim
Driver Diagram • Step 1: Aim • Target • Numerical goal for improvement • Time frame • Location (place or # of clinics)
Secondary Drivers Interventions Primary Drivers Aim
Driver Diagram • Step 1: Aim • Time frame • Location • Step 2: Primary Drivers • Make a list of broad categories of factors that must be addressed to achieve aim
Secondary Drivers Interventions Primary Drivers Aim
Driver Diagram • Step 1: Aim • Time frame • Location • Step 2: Primary Drivers • Make a list of factors that must be addressed to achieve aim • Step 3: Secondary Drivers • Specific problems under each category • Step 4: Match specific interventions to each driver
Secondary Drivers Interventions Primary Drivers Aim Continue to fill in and complete boxes for all secondary drivers and interventions
Focusing Matrix • Tool to aid in prioritizing interventions • Uses both importance and ease of implementation to rank priority An example…
Focusing Matrix Ease of Implementation
Focusing Matrix Ease of Implementation # 2 priority most important and easiest to implement – #1 priority
Prioritizing InterventionsExample: Low ART Initiations (adult) EASE of IMPLEMENTATION Interventions B and A should be first priority
4. Choosing Priority Sites Highest Volume Lowest Performance 65% 80% 42% 55% 30% 75% 20% 85% 66% 40% 35% 80%
5. Cohort Methodology to measure change in performance towards target • Goal is to assess impact of approach on relevant target and cascade indicators • Impact must be sustainable • A cohort methodology: • Define cohorts of patients • Collect cascade data for cohort from source documents • Summarize graphically • Review data and revisit intervention plans • Repeat process 2-4 periodically (e.g., every month)
Define Cohorts of Patients • A cohort is a group of people sharing a common trait, usually defined by a point in time (e.g., birth cohort of people born in 1981) • For this cascade approach, define cohort as any patient who entered the cascade during a specified time period, e.g.: • Patients testing HIV-positive at Kagera Regional Hospital during January 2013 • Patients enrolling in HIV care at RFM Hospital during 2011
Collect cascade data for cohort from source documents • Operationalize the steps in relevant cascade • # enrolling in HIV care • # with ART eligibility assessed via CD4/WHO stage • # ART eligible • # initiating ART • # retained on ART (e.g., at 6 months, 12 months) • Specify the best source of data for each step • Design simple tools (paper, Excel) for abstracting and summarizing this data • Plan for periodic data collection • Measuring retrospective improvements • Measuring improvements moving foward
Summarize cohort in a graph Intervention begins 58% 71% 36% 36% 20
Summarize cohort in a graph Intervention begins 73% 58% 58% 36% 36%
Summarize cohort in a graph Intervention begins 79% 73% 58% 70% 58% 36%
Summarize cohort in a graph Intervention begins 79% 95% 73% 58% 88% 70% 58% 36%
Summarize cohort in a graph Intervention begins 99% 79% 95% 73% 58% 91% 88% 70% 58%
Review data and revisit intervention plan • Review pre- and post-intervention cohort data • Identify successes and ongoing challenges • Take inventory of factors enabling program improvement • Outline likely barriers to improvement • Consider revising intervention plan • Identify activities to keep in place, those to drop, and any new activities to begin • Keep in mind sustainability of activities and improvements • Repeat this process as new cohort data becomes available
Webinar Overview • Background • Examples of low target performance • Dimensions of the problem: M&E & Clinical • Introduce a cascade approach • A case study • Toolkit inventory
Case Study: ART Initiations • ICAP Swaziland at end of Q3 reported reaching 50% of annual target for ART initiations • Dimensions: M&E, Clinical • The Cascade approach was implemented with the following steps and results • Identify steps in the cascade that relate to target • Identify baseline data to operationalize cascade • Choose priority sites • Choose interventions and prioritize them • Use a cohort methodology
1. Identify steps in the Cascade • # persons test HIV + (not reliable) • # persons enroll in HIV care • # persons assessed for ART eligibility (WHO, CD4) • # persons eligible for ART • # persons initiated ART
3. Choose priority sites • 10 largest volume clinics in 3 regions = 30 sites • Volume was defined as # of patients enrolling in HIV care in the past quarter
Choose interventions and prioritize them • Identify patients with known ART eligibility but no ART initiation and put them in a “expectant” patient box for expert clients to call to return to care • Introduce WHO Staging job aid to assist providers to assess patients for ART eligibility given reports of CD4 stock outs • Transfer reported CD4 results from lab registers to patient charts