Download
1 / 65
660 likes | 785 Vues
Attention Response Functions: Characterizing Brain Areas Using fMRI Activation during Parametric Variations of Attentional Load. Intro. Examine attention response functions Compare an attention-demanding task to a non-attentional control task

E N D
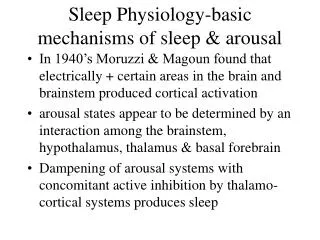
Attention Response Functions: Characterizing Brain Areas Using fMRI Activation during Parametric Variations of Attentional Load
Intro • Examine attention response functions • Compare an attention-demanding task to a non-attentional control task • Examine how activation in different regions is affected by additional increases in attentional load • Parametric design (vs. subtraction)
Parametric vs. subtraction design • Subtraction: • Requires inclusion/exclusion of a single mental process – concept of “pure insertion” • BALANCE the “off” and “on” blocks so only one thing is altered
Assumptions: • Neural structures supporting cognitive and behavioral processes combine in a simple additive manner • “Pure insertion”: a new cognitive component can be purely inserted without affecting the expression of previous ones • BUT processes probably combine in a non-additive/interactive fashion
Parametric design: • Examine the brain responses to increasing frequency of stimulus presentation in different contexts and look for a differential sensitivity to increasing presentation rate.
Major goal of study • Use a parametric load manipulation to disentangle the functions of the cortical regions that have been shown to be activated by both attention and eye movements
Hypothesis • Areas directly involved in attentional processing would show steadily increasing activation as attentional load is increased • Regions with activation due to eye movement factors would be activated by attention to one target but would show no further response gains as more targets were added
Specifically interested in the activation function of the frontal eye fields (FEF) • Are reliably activated by attentional tasks • But have been postulated by some to serve purely oculomotor functions and remaine largely unaffected by cognitive factors
“Task-only'' regions that are not directly involved in attentional performance would show a task effect with no further increase in activation as task difficulty increases • Regions that are directly involved in attentional performance would show ''load-dependent'' activity that increases with attentional demands, being greater at high loads than low loads only regions not directly
9 balls move randomly • Subjects fixate on center point • Attentive tracking epochs • A subset of 1 – 5 balls turn red for 2 s then turn green • Subject track the cued balls for 17 s • Passive epochs – 11 s • No balls are cued • Passively watch the display without paying attention to any particular balls
Demo – track 3 ballshttp://defiant.ssc.uwo.ca/Jody_web/share/ARF_Neuron/attentive_tracking_demo.htm
8 Subjects • Test trials – after done attentive tracking, a single ball turned white and the subject had to indicate whether the white ball was a tracked target or not • MRI • 1. 5 T • Asymmetric spin echo pulse
Data Analysis • Two components/contrasts • Task-related activation = task effect • Compared all attentive tracking tasks (equally weighted) to baseline • Activation that increased with attentional load during the task = load effect • Estimated the degree to which activation increased with task load • (Group-averaged data)
Voxels in which the task regressor contributed significantly more than the load regressor (p < .001) are red • Voxels in which the load regressor contributed significantly more than the task regressor (p < .001) are green • Voxels with no significant difference between the two regressors are yellow
Task regressor > load regressor (red) • FEF • SPL • Medial precuneus • MT+ complex
Load regressor > task regressor (green) • SFS – superior frontal sulcus • PreCS – precentral sulcus • SMA • AntlPS – anterior intraparietal sulcus • IPS – posterior intraparietal sulcus • IPL – inferior parietal lobule • TrlPS – transverse occipital sulcus
Voxels with no significant difference between the two regressors are yellow • Transition zones – possibly due to blurring when Talairach averaging
Discussion • Task-specific functions not affected by increasing demands on attention • Attention-specific functions become more engaged as attentional demand increases
Task-specific • Gain in activation between active and passive conditions – but no additional gain as more items are added • Not driven by attention per se (not involved in multiple object tracking) • More likely basic support functions of the task • Planning a saccade • Suppressing eye movements
Attention-specific/Load-dependent • Load-related increase – these areas play a role in task performance • IPS – may be involved in spatial attention and working memory • SFS – working memory • PreCS – visual working memory and cognitive set switching • TrlPS – motion-selective – attentional tracking of moving targets
General conclusions • Task functions – support overall performance • Load functions – directly involved in handling increased load • Parametric design – may have not seen these functional differences had a simple subtraction paradigm been used
Effect of Spatial Attention on the Responses of Area MT Neurons
Introduction • Bottom-up vs. Top-down attention • Bottom-up = automatic – pop-out effects • Top-down = voluntary, goal-directed – flexibility in directing attention to different stimuli in the same visual scene
Where is attention modulated in the brain? • Bottom-up – assumed to be at very early processing stages • Top-down – early vs. late selection
Early selection • Attention influences early stages of the visual system to allow for more efficient use of limited capacities at all subsequent stages • Late selection • Top-down mechanisms filter out irrelevant info only at late processing stages – after perception but before behavioral responses
Treue and Maunsell (1996) study • Very strong attentional modulation in MT • Monkey had to attend to one moving target among distracter targets • Report when target changed speed • When two targets moved in opposite directions in the RF of an MT or MST neuron, response dominated by the attended target • Strong response when attended target moved in cell's preferred direction (>80%) • Weak response when attended target moved in null direction
These results vary from previous studies that failed to find substantial attentional effects in MT
To test see if this could be replicated – this study recorded from MT neurons while monkey performed a spatial attention task
Methods • On each trial, two apertures of random-dot stimuli appeared simultaneously in two spatially separated locations • The monkey was required to discriminate the direction of motion in one aperture while ignoring the direction of motion in the other (distracter) aperture
The apertures could be within the same RF (A) or large and spatially remote (B)
Each trial starts with Fixation • After fixation, a circular aperture of stationary dots appears at one of two possible locations • Stationary dots inform the monkey which aperture location to attend
After stationary dots disappear, 2 circular apertures of random dots appear in the 2 spatial locations • In each aperture, a fraction of the dots move coherently in 1 of 2 possible directions (preferred or null) while the other dots are re-plotted at random locations • Monkey was required to discriminate the direction of motion at the attended location (cued by the stationary dots) and ignore motion at the other location
After offset of the random-dot stimulus, 2 saccade targets appear • Monkey indicates the perceived direction of motion at the attended location by making a saccadic eye movement to the corresponding target
Data analysis • Recorded from MT neurons • Quantify attentional effect by comparing the responses of individual MT neurons to identical visual display conditions when the monkey was instructed to attend to one or the other aperture • Neuronal responses were measured as the number of spikes that the cell fired during the 1-s presentation of the motion stimuli
For each of the four visual display conditions, compared the mean response in the two attentional states using a selectivity ratio (SR) index
The SR can assume values between - 1 and 1 • A value of 0.33 indicates that the responses are modulated by the attentional state • A value close to zero implies that the responses of the neuron are not modulated by spatial attention.
Results – effect of spatial attention on responses of MT neurons • Predict: attentional effect to be maximized when both apertures are presented within the RF and effects to be strongest when attending to preferred direction of motion (based on previous studies…) • Aperture problem link: http://www.psico.univ.trieste.it/labs/perclab/integration/english_version/aperture.php3
Attend lower Attend upper
Four possible stimulus configurations are shown in the 4 panels (A-D) • A – response strongest when both apertures moved in preferred direction • B, C – responses were intermediate when apertures moved in opposite directions • D – weakest when both apertures moved in null directions
Data from one of the largest attentional effects observed in the within RF configuration: • B and C – the response differed between the two attentional states • B – 44% stronger when attend to lower apertures – preferred direction • C – 50% stronger when instructed to attend to upper aperture – preferred direction • The responses of the cell to identical visual displays conditions were modulated by the spatial location to which the monkey attended
Remote condition Attend RF aperture Attend remote aperture
If spatial attention influences MT neurons in the remote config – expect the responses to be stronger when the monkey is instructed to attend to the stim within the RF • A and B – 11% and 23% modulation • No significant attentional modulation when null direction motion appeared in the RF (C and D)
Distribution of the selectivity ratio index combined over the 2 monkeys
4 A – within RF – (Figure 2 B, C) • The distribution of the SRs is shifted to the right of zero • Indicates that MT neurons responded to identical visual stimuli more strongly when the monkey attended to the spatial location that contained the preferred direction of motion • The magnitude of this effect is significant (t-test, P < 0.00005) • The average SR is 0.042 • Corresponds to an 8.7% increase in firing rate when monkeys attended to preferred stim