2.8 Exploring Data: Quadratic Models
40 likes | 77 Vues
2.8 Exploring Data: Quadratic Models. Students will classify scatter plots. Students will use scatter plots and a graphing utility to find quadratic models for data. Students will choose a model that best fits a set of data. Example 1.

2.8 Exploring Data: Quadratic Models
E N D
Presentation Transcript
2.8 Exploring Data: Quadratic Models Students will classify scatter plots. Students will use scatter plots and a graphing utility to find quadratic models for data. Students will choose a model that best fits a set of data.
Example 1 • Decide whether each data set would best be modeled by a linear model or a quadratic model. • a) (1, 3), (2, 5), (4, 6), (6, 8), (8, 9), (10, 10), (12, 13) • b) (2, 1), (4, 2), (6, 4), (8, 7), (9, 10), (11, 15), (13, 20) • Enter both sets of data into a graphing utility and display the scatter plots.
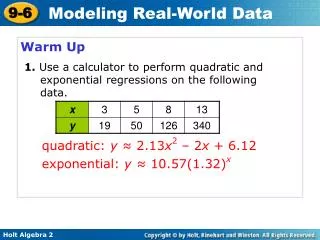
Example 2 The following table gives the mileage y, in miles per gallon, of a certain car at various speeds x (in miles per hour). a) Use a graphing utility to create a scatter plot of the data. b) Use the regression feature of a graphing utility to find a quadratic model that best fits the data. c) Use the model to predict the speed that gives the greatest mileage. Speed, x Mileage, y 10, 21.3 45, 31.9 15, 23.7 50, 29.5 20, 25.9 55, 27.6 25, 27.6 60, 25.3 30, 29.4 65, 23.0 35, 31.0 70, 20.0 40, 31.7
Example 3 For the data points below, determine whether a linear model or a quadratic model best fits the data. (1, 5) (2, 6) (3, 8) (4, 9) (5, 11) (6, 10) (7, 11) (8, 12) (9, 14) (10, 16)