Download
1 / 61
610 likes | 633 Vues
Calculate Clearance (Cl), Volume (V), and Half-life (t1/2) for different drug administration scenarios using data and graphing methods. Includes step-by-step instructions and equations.

E N D
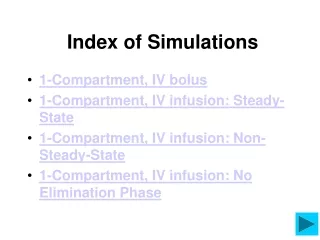
Index of Simulations • 1-Compartment, IV bolus • 1-Compartment, IV infusion: Steady-State • 1-Compartment, IV infusion: Non-Steady-State • 1-Compartment, IV infusion: No Elimination Phase
1-Compartment, IV Bolus • The following data were obtained after 100 mg of Drug X was administered to a healthy volunteer. Blood was collected starting at one-hour post-dose for a total of 12 hours. Calculate Cl, V and t1/2
Log scale Linear scale Step 1) Graph on Semi-log Paper
Step 3) Find V • Use the relationship: • Rearranged for V: • We know X0 (100 mg) and C0 we can get from the graph
Step 3) Find V C0 C0 = 400 ug/L 400 300 200
Step 3) Find V • We know X0 (100 mg) and C0 we can get from the graph (C0 = 400 ug/L) (please watch units) • Now we have our volume (250 L)
Step 4) Find t1/2 (and k) • Half-life (t1/2) can be obtained directly from the graph by reading how long it takes for the concentration to be reduced by 50%
C0 = 400 ug/L 200 t1/2 = 3 Step 4) Find t1/2 Half of 400 is 200. Draw a line from 200 across until it intersects your best fit line At the intesection, draw a line down to the X-axis (time). Read the value the line intersects the axis…this is t1/2 Start with C0 which equals 400 ug/L Your t1/2 is ~3 hours
Step 5) Find Cl • Clearance (Cl) can be calculated from k (Step 4) and V (Step 4) and using the following equation:
Summary • Cl = 57.8 L/h • V = 250 L • t1/2 = 3 h Onto Steady-State Infusion Return to Table of Contents
1-Compartment, IV Infusion: Steady-State • The following data were obtained after 100 mg of Drug X was infused over 15 hours to a healthy volunteer. Blood was collected starting at one-hour post-dose for a total of 24 hours. Calculate Cl, V and t1/2
Log scale Linear scale Step 1) Graph on Semi-log Paper
Step 2) Find t1/2 (and k) • Half-life (t1/2) can be obtained directly from the graph by reading how long it takes for the concentration to be reduced by 50%. • For infusions, you must use the terminal portion where concentrations are falling!! • First however, draw a best fit line through the terminal portion
C ~ 110 ug/L 55 t1/2 = 18 - 15 Step 2) Find t1/2 Your t1/2 is the time you just read minus infusion time (18 h – 15 h = 3 hours) At the intesection, draw a line down to the X-axis (time). Read the value the line intersects the axis… Start with C which you know C at 15 h = 110 ug/L Half of 110 is 55. Draw a line from 55 across until it intersects your best fit line
Step 2) Find t1/2 (and k) • Half-life (t1/2) from the graph is 3 hours. We can find k by the following equation:
Step 3) Find Cl • Clearance (Cl) can be calculated from the steady-state concentration (Css) and the infusion rate (k0) using the equation: • Rearranged to:
Step 3) Find Cl • We know the dose (100 mg) and infusion time (T=15 h), therefore infusion rate is:
Step 3) Find Cl • We can obtain Css from the graph by looking to see when concentrations stop changing. • How do we know for sure this is steady-state? Remember steady-state is 3-5 half-lives. • Half-life from Step 2 = 3h • 3 x 5 (or 3 or 4) = 15 h • Infusion was stop at 15 hours therefore we are at steady-state and this approach is valid
Step 3) Find Cl Css= 110 ug/L
Step 3) Find Cl • We have k0 (6.67 mg/h), we have CSS (110 ug/L), now we can calculate Cl
Step 4) Find V • Volume (V) can be calculated from k (Step 3) and Cl (Step 1) and using the following equation: • Rearrange and solve for V
Summary • Cl = 60.6 L/h • V = 262 L • t1/2 = 3 h Onto Non-Steady-State Infusion Return to Table of Contents
1-Compartment, IV Infusion: Non-Steady-State • The following data were obtained after 100 mg of Drug X was infused over 6 hours to a healthy volunteer. Blood was collected starting at one-hour post-dose for a total of 24 hours. Calculate Cl, V and t1/2
Log scale Linear scale Step 1) Graph on Semi-log Paper
Step 2) Find t1/2 (and k) • Half-life (t1/2) can be obtained directly from the graph by reading how long it takes for the concentration to be reduced by 50%. • For infusions, you must use the terminal portion where concentrations are falling!! • First however, draw a best fit line through the terminal portion
C ~ 260 ug/L 130 t1/2 = 10 - 6 Step 2) Find t1/2 Your t1/2 is the time you just read minus infusion time (10 h – 6 h = 4 hours) At the intesection, draw a line down to the X-axis (time). Read the value the line intersects the axis… Start with C which you know. C at 6 h = 260 ug/L Half of 260 is 130. Draw a line from 130 across until it intersects your best fit line
Step 2) Find t1/2 (and k) • Half-life (t1/2) from the graph is 3 hours. We can find k by the following equation:
Step 3) Find Cl • Clearance (Cl) can be calculated two-ways. Please select a method to calculate clearance • AUC Method – More exact but more calculations • Equation Method – Quicker but less exact
Clearance Via AUC • To calculate clearance via the AUC, you must first calculate the AUC via the trapezoidal rule
Trapezoidal Rule C2 For this method, we break the curve into individual trapezoids as shown here… The area of the trapezoid (or this case a triangle) is the average height (C1+C2)/2 multiplied by the base (t2-t1) C1 t1 t2
Step 3: Calculate Cl • Since we now have AUC, using the dose (100 mg), and the equation: • Solve for Cl: Select another Cl calculation Go to Volume calculation
Clearance via Infusion Equation • We can use the equation that describes an infusion and solve for Cl. • During Infusion (t = time during infusion) • Solving for Cl
Clearance via Equation • Now plug in the values we know (infusion rate, C, t, k) Select another Cl calculation Go to Volume calculation
Step 3) Find Cl • We know the dose (100 mg) and infusion time (T=15 h), therefore infusion rate is:
Step 3) Find Cl • We can obtain Css from the graph by looking to see when concentrations stop changing. • How do we know for sure this is steady-state? Remember steady-state is 3-5 half-lives. • Half-life from Step 2 = 3h • 3 x 5 (or 3 or 4) = 15 h • Infusion was stop at 15 hours therefore we are at steady-state and this approach is valid
Step 3) Find Cl Css= 110 ug/L
Step 3) Find Cl • We have k0 (6.67 mg/h), we have CSS (110 ug/L), now we can calculate Cl
Step 4) Find V • Volume (V) can be calculated from k (Step 2) and Cl (Step 3) and using the following equation: • Rearrange and solve for V
1-Compartment, IV infusion: No elimination phase • The following data were obtained after 100 mg of Drug X was infused over 15 hours to a healthy volunteer. Blood was collected starting at one-hour post-dose for a total of 15 hours. Calculate Cl, V and t1/2
Log scale Linear scale Step 1) Graph on Semi-log Paper
Step 2) Find t1/2 (and k) • Since we do not have an elimination phase, we must find another way to estimate half-life. We will use the approach to steady-state method. • So first we need to estimate CSS
Step 2) Find CSS We can estimate CSs either taking the average of the last few concentrations or use a best fit line Just read CSS from the intercept of the Y-axis 106.5 ug/L