Download
1 / 29
310 likes | 461 Vues
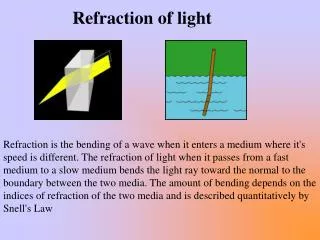
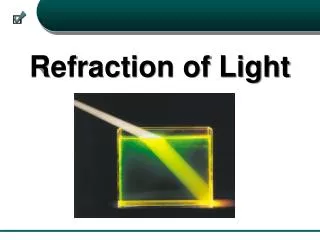
Index of Refraction. Light slows down as it enters or travels near the particle; redirection of incident light field Constant for water with given S and T About 1.33 for fresh and 1.34 for salt Interested in n subs /n water 1.15 – 1.22 for mineral substances 1.02 – 1.09 for organic particles

E N D
Index of Refraction • Light slows down as it enters or travels near the particle; redirection of incident light field • Constant for water with given S and T • About 1.33 for fresh and 1.34 for salt • Interested in nsubs/nwater • 1.15 – 1.22 for mineral substances • 1.02 – 1.09 for organic particles • 0.75 for air bubbles
Absorption and Scattering • Absorptance • a/0 • Scatterance • b/0 • Attenuance • (a+b)/0 • Transmittance • [0– (a+b)] /0
a = dA / dx = (da/0 ) / dx , b = dB / dx = (db/0 ) / dx . Intensity is proportional to the incident power and to the elementary thinkness Via the volume scattering function
Scattering • b = 2( ) sin d • bf = 2( ) sin d • bb = 2( ) sin d • How to determine the VSF?
Ramen Effect • Water molecules can be excited at one wavelength and emitted at another • Emission can take place at any wavelength • Different from fluorescence emission which occur at fixed wavelengths
Radiance (L) = power in a specified direction per unit solid angle, per unit Area All AOPs derived from this Ed is downwelling irradiance – integrate upper hemisphere Can use cosine plate detector for measurement dEd(z) = - Kd (z) Ed(z) dz Diffuse attenuation coefficient changes with depth AOPs
Flux Density • = d • Describes radiant energy available for a phytoplanktonic cell • Why 4pi?
Reflectance • R(,z) = Eu(,z ) / Ed (,z ) • We are interested in this quantiy because it is directly realted to IOPs • R() = f [bb()/ (a ()+ bb())] • f varies between 0.3 and 0.5 • RRS () = Lw(,0+, , ) / Ed (,0+)
Radiance Transfer Equation • Relates AOPs to IOPs
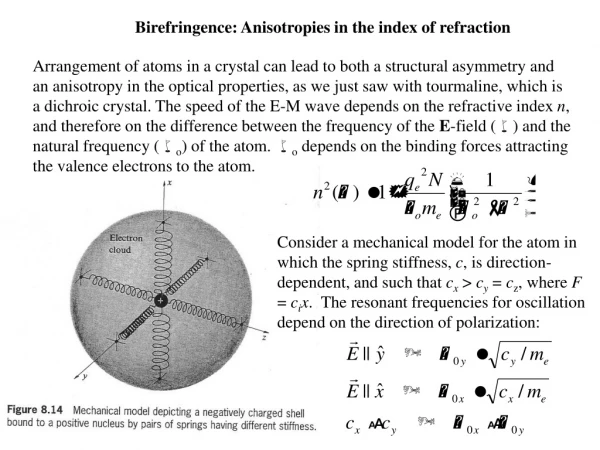
Mie theory • Helps to interpret the optical behavior of marine particles assuming on average they behave optically as spheres • Important parameters: -relative size: = D/w -relative index of refraction: m = n – in’ with n = ns / nw and n’= n’s/ nw • n’s is the complex index of refraction = as 0 / 4
dispersion • A transparent medium has an index of refraction which increases with frequency (normal dispersion) • Absorption bands result in anomalous dispersion: • The real part n() is depressed when <a and enhanced after the absorption band when >a
Van de Hulst approx. • Applies to algal and other biological materials where: D> and m ~= 1 • Algal cells are strongly absorbing at certain frequencies of energy due to their high pigment content and n’s ~= 10-2 becomes important • The absorption coefficient is as high as 105 m-1 in the blue band (440 nm) and in the red band (675 nm)
various overlapping absorption bands lead to complex n() and n’() spectrums
More terms! • = 2 (n-1) and ’ = 4 n’ • Qa is a function of ’ and Qc depends on both and ’ • The “Package effect” • A non-linear response to the absorption capacity wrt size or as • ’ represents the dimensionless quantity Das • A doubling of D or as does not induce a doubling or Qa, but only an increase by some factor less than 2 • Near ’ = 0, Qa (2/3) ’ as may also double from a change in causing “flattening” of the spectral peaks
Specific optical coefficients • Physical constant characteristic of a given molecule or ion • chl-specific absorption coefficient: a*() = aphi() / [chl] • aphi() is the measured absorption coefficient (of a water body) that is due to the presence of algae • the chl concentration within the water [chl] can be calculated
a*susp = N g Qa / N v Cchl - for spheres, the g- to-v ratio is 3/2 D, so that, a*susp = (3/2) Qa / D Cchl note: a*susp is no longer a constant
substitute ’ = Das and obtain: Q*a(’) = (3/2) Qa(’)/ ’ • a “solution” corresponds to D = 0 or ’ = 0 • now Qa (2/3) ’ b/c Q*a(’) = 1 for ’ = 0 • the package effect can be quantified as the ratio: a*susp / a*sol = Q*a(’) Q*a values for cultured species range from 1 (no package) to about 0.3 a*sol is a hypothetical solution where the chl molecules are uniformly distributed
Case 1 97% of ocean Phytoplankton are principle components of optical properties Case 2 Influenced by river discharges, CDOM, suspended sediment Case 1 vs. Case 2 waters • Continuous size distribution 9-10 orders of magnitude • 104 times more particles when size decreased by factor of 10
Filtration Filter soaked in solvent to remove pigment – gives absorption non-algal particles Obtain absorption of algal particles by subtraction Direct Measurement Ac-9 Two methods to determine spectral absorption
Left: algal components Right: particulate components (note maxima generally follow maxima of phytoplankton because non-algal components are characterized by monotonic increase toward shorter wavelengths) Decrease by about one order of magnitude from oligotrophic to eutrophic waters Anap contributes 25-35%
Package Effect – Case 1 • Shape of ap spectrum changes with [chl], becomes flatter for high [chl] • Spectral shape can be related to characteristics of size distribution of resident phytoplankton population • ap(440) = 0.052 [chl]0.64 • ap(675) = 0.020 [chl]0.82
Global Particle Scattering • Case 1 waters • bp(550) = 0.3 [chl]0.62 • Case 2 waters • bp(550) = 0.4 [chl]0.76 • Coefficient is spectrally varying according to (3-j ) • Non linear relationship because varying proportions of algal and non-algal particles • Theory well matches Case 1 water observations – can get a good measure of average particle size
IOP Closure Problem • Bulk absoprtion coefficient is the sum of the absorption coefficient of all the constituents • However, the sum of the backscattering coefficients of the constituents do not add to the bulk back scattering coefficient • Non-linearity • Not accounting for bubbles, or sub-micrometer particles which may contribute to bulk of backscattering coefficient
In Situ Techniques • Absorption measurements are limited due to large amounts of absorbing substances besides phytoplankton (mostly in case 2 waters) • Normally a base line (at 650 and 725 nm) is determined above which the absorption peak of Chlorophyll (at 675 nm) can be detected • the spectral signal becomes less distinct in Case 1 waters and completely drowned out in case 2 waters by dissolved colored compounds and sediments.
Fluorescence is more selective • …Instead chlorophyll fluorescence is used: • Provides a clear signal due to the presence of phytoplankton • The diffuse attenuation coefficient for downwelling irradiance is used: Kd() • Near the surface Kd() is almost an inherent property (with some correction) • µw Kd a + bb where µw is the cosine of the under water sun-zenith angle (after refraction) and bb is very small compared to a
Remote techniques • The satellite MERIS measures the sun-induced chl-a flourescence signal • Appropriate channels on either side of the fluorescence emission (660 and 709 nm for MERIS) isolate the signal from the background • Small inaccuracies often develop due to the atmospheric backscattered signal which must be removed
Detecting blooms • The fluorescence signal is emitted near 685 nm which is where sea water is strongly absorbing • As a result, much of the signal originates from the very upper layer of ocean • 90% originates in the upper 2-3 m in oligotrophic water • Easily detects blooms of buoyant algae but blooms vertically dispersed or concentrated at depth are less distinguishable
A more accurate method involves forming the ratio between marine reflectance and two wavelengths which can be related to the chl concentration • Applicable only to case 1 waters • the ratio of two reflectances, one in the blue (at 443 or 490 nm) and the other in the green (at 560 nm) steadily decreases as [chl] increases • Fails in water with high algal concentration b/c a peak in reflectance develops at the minimum of algal absorption (560-570 nm)