Download
1 / 31
310 likes | 348 Vues
Explore the theoretical, empirical, and policy aspects of infrastructure and growth. Discuss issues like marginal social benefit, estimation problems, causality, and measuring the effects of infrastructure on economic growth. Study the role of paved roads, electricity generating capacity, and telephone main lines. Findings reveal varied impacts across countries, highlighting heterogeneity in infrastructure's effects on income. Discover the productivity of infrastructure from 1960-2000, examining the aggregate production function and cointegration relationships.

E N D
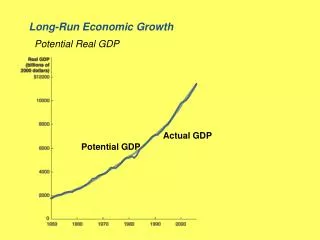
Infrastructure and Long Run Economic Growth David Canning Infrastructure and Growth: Theory, Empirical Evidence and policy Lessons Cape Town 29-31 May 2006
Theory • Public goods • Raises issues of level of provision • This argument is weakening with new technology • Externalities to Infrastructure • Price may be less than the marginal social benefit
Externalities • Extent of the market • Specialization • Contestability and pricing • Intermediate goods • Specialization • The big push – escape the poverty trap • Power and industrialization
Marginal social benefit– look at the effect on aggregate output Estimation problems • Measurement • capital stock • Reverse causality • Income leads to investment • Omitted Variable bias • Proxy for K or industrialization • Bottlenecks/Threshold Effects • Functional form
Two approaches • Estimate the marginal product of infrastructure using an aggregate production function and compare with the cost • Test for the direction of causality between infrastructure and economic growth
Estimating The Effect of Infrastructure on Aggregate Output • Flexible functional form to allow for infrastructure “shortages”. • Double counting effect since infrastructure is already included in physical capital. • Effect estimated is of reallocating capital from other sources to infrastructure.
Causality - Theory • Infrastructure has a cost and diverts resources form other activities • Growth effect of extra infrastructure depends on whether it is above or below its growth maximizing level – Barro 1990
Causality- estimation • Granger Causality • Do innovations in infrastructure lead to growth? • Income and Infrastructure are Non-stationary • Causality in non-stationary series
First Differences • We could estimate relationship between infrastructure and income in first differences – produces stationarity • But the long run effect depends on the infinite sum of the responses – high standard error.
Co integration and error correction • We have a long run relationship • We can write the system as a set of error correction mechanisms
Causality • Long run causality depends only on the signs on the error correction terms • No causality from g to y if • sign of effect in the long run is the same as the sign of
Infrastructure Physical Measures • Paved Roads • Electricity Generating Capacity • Telephone main lines (to 1992) • Using value of investment may be misleading due to price differences across countries
Table 4Tests for Presence of Long Run Effects • Null Hypothesis: No Long Run Effects from Infrastructure to Income –Joint Test TEL to Y 325*** (67) EGC to Y 164*** (43) PAV to Y 211*** (42)
Table 5Tests of Parameter Homogeneity for Long Run Effects Across Countries Null Hypothesis: Homogeneity of parameters across countries Test of Test of Wald Test Wald Test TEL to Y 232*** 101*** (67) (67) EGC to Y 124*** 46 (43) (43) PAV to Y 153*** 57* (42) (42)
Table 6Sign of the Effect Group Mean Percentage of Countries Rejecting Alternative: TEL to Y -0.014 14.9* 16.4** 16.4** N=67 (0.023) EGC to Y 0.024 14.0 9.3 16.3* N=43 (0.028) PAV to Y 0.027 16.7* 21.4*** 9.5 N=42 (0.061)
Conclusion • Evidence that Income has a long run effect on Infrastructure • Evidence that Infrastructure has a long run effect on Income • Evidence of Heterogeneity in the sign of the effect • Many countries appear to be near the growth maximizing infrastructure level while some have too much and some have tool little.
Reverse Causality • Estimation must take account of reverse causality. • We use cointegration techniques and find significant results. • Results with more standard instrumental variables methods are similar in pattern but estimates of infrastructure effect are not statistically significant.
Results • In general, the rate of return to road infrastructure in most countries is the same or lower than of capital in general. • A few fast growing economies (e.g. South Korea) exhibit infrastructure shortages and very high rates of return to roads. • Rates of return are somewhat higher in middle income countries where the cost of road building is low.
Estimation of the Productivity of Infrastructure 1960-2000 • Estimate the Productivity Effect • Aggregate Production function • Includes capital, labor, education and health, as well as infrastructure (paved roads, electricity generating capacity, telephone main lines).
Old Approach • Estimate co integration relationship – identify it as the production function • Significant effects for infrastructure – excess returns relative to other capital • Problem – cointegrating relationship is likely to be an average of the production function and infrastructure investment equations and the parameters are not indentified
New approach • Identify the production function as an error correction mechanism for income • Allows for other cointegrating relationships in the data • Can be derived from a model of technological diffusion
Total Factor Productivity and Economic Growth • Production function in logs • We need a model of total factor productivity • Steady state level of TFP
Value of Lagged TFP • Proxy lagged TFP with lagged income per worker • Baumol 1986 • Dowrick and Rogers 2002 • Fagerberg 1994 • It seems better to use actual lagged TFP • Bloom, Canning, and Sevilla 2002 • Blundell and Bond 2000 • De La Fuente and Domenech 2001 • Griliches and Mairesse 1998
Estimating Equation • Differencing the production function • Estimating Equation
Interpretation • If = 0 we have production function in first differences as in Krueger and Lindahl 2001. • We can add factors that might affect steady state TFP - similar to growth regressions. • Catch up term is productivity growth, not convergence of capital to its steady state level with a fixed saving rate.
Panel • 89 countries with growth in five year intervals between 1960 and 2000 -364 observations • Instrument current growth rates of inputs with lagged growth rates (over-identifying restriction test of validity not rejected) • Impose same sort run and long run parameters (restriction tested and not rejected) • Include time dummies and a range of factors that affect TFP – geography and institutions
Results - Base Line Coefficient t-statisitc Capital 0.272 *** (2.83) Labor 0.742 *** (6.60) Schooling 0.152 ** (2.34) Life expectacny 0 .051 *** (3.42) Catch up 0 .146*** (3.84)
Adding Infrastructure Coefficient t-statisitc Telephones 0.195* (1.69) Electricity -0.010 (0.15) Paved raods BR -0.082 (0.98)
Conclusion • Infrastructure is already included in capital • We are testing for excess returns to infrastructure • Some evidence of excess returns to telephones • No evidence of excess returns to roads and electricity • Results are averages – country specific effects are likely to differ